In this article, we will cover the following topics in detail –
Download the Excel Workbook below to follow along and understand how to display Descriptive Statistics in Excel –
download excel workbookDescriptive-Statistics-in-Excel.xlsx
Introduction to Description Statistics in Excel
Description Statistics is an in-built tool available in Excel for data analysis. It is part of Analysis ToolPak in Excel.
These statistics help us understand the central tendency, variability, and distribution of data points. It enables users to gain insights into their data without the need for advanced statistical software.
The different statistical values that are displayed in descriptive statistics are as follows –
- Mean: The arithmetic average of the dataset values.
- Standard Error: The measure of the variability between predicted and actual values in the dataset.
- Median: The central value that separates the higher and lower halves of the dataset.
- Mode: The most frequently occurring value in the dataset.
- Standard Deviation: A measure of how much the dataset values deviate from the mean.
- Sample Variance: The squared standard deviation, indicates the dataset’s variability.
- Kurtosis: The descriptor of the tail behavior in the dataset’s distribution.
- Skewness: The measure of asymmetry in the dataset’s distribution.
- Range: The difference between the highest and lowest values in the dataset.
- Minimum: The smallest value present in the dataset.
- Maximum: The largest value present in the dataset.
- Sum: The total obtained by adding all the values in the dataset.
- Count: The number of values in the dataset.
- Largest(X): The highest X value recorded in the dataset.
- Smallest(X): The lowest X value observed in the dataset.
- Confidence Level(X) Percentage: The confidence level associated with a specified percentage for the dataset values.
Step-wise Execution
Suppose you are an investor who has been tracking the returns of an investment portfolio over the past year. The portfolio consists of various stocks and bonds. You have collected the monthly returns (in percentage) for each month, resulting in the following dataset:
We can easily follow the steps below to display Descriptive Statistics in Excel for this data –
Before we start, go to Data Tab in Excel Ribbon and look for Data Analysis. If not found, follow the steps below to install it. Otherwise, you can go to STEP 3 directly.
STEP 1: Go to Search Bar and type Add-Ins.
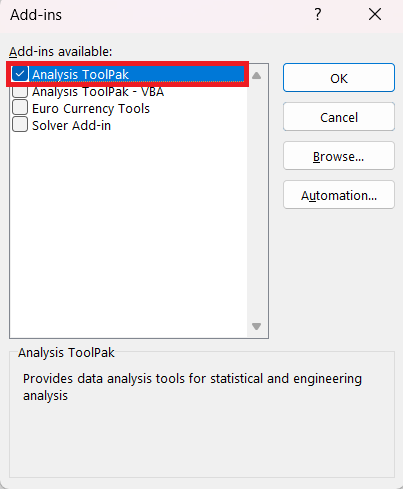
STEP 2: Select Analysis ToolPak and Click OK.
STEP 3: Go to Data Tab > Data Analysis.
STEP 4: In the Data Analysis dialog box, select Descriptive Statistics and click OK.
STEP 5: In the Descriptive Statistics dialog box, select cell range as Input Range.
STEP 6: Select a cell for Output Range.
STEP 7: Check the Summary Statistics checkbox and click OK.
The output will now be displayed!
Interpretation of Results
- Mean (Average) Return: The portfolio’s average monthly return is approximately 2.5%. This indicates that, on average, the portfolio has been generating positive returns over the year.
- Median: The median return of 3.4% lies close to the mean. This implies a roughly symmetric distribution of returns.
- Mode: No mode indicates a diverse set of returns without any recurring pattern.
- Standard Deviation: With a standard deviation of around 2.7%, the returns exhibit moderate variability around the mean. This suggests that the portfolio’s performance has been relatively stable, with returns clustered within this range.
- Range: The range of 8.3% showcases the spread between the highest and lowest returns, revealing the potential for significant variability.
- Minimum Return: The lowest return of -2.1% indicates the worst-performing month in terms of returns.
- Maximum Return: The highest return of 6.2% represents the best-performing month.
- Sum of Returns: The cumulative sum of all returns amounts to 30.4%, indicating the overall performance of the portfolio.
- Count: With 12 monthly returns, the dataset covers a year’s worth of performance.
From the descriptive statistics analysis, it can be deduced that the investment portfolio has generated an average monthly return of approximately 2.53%, indicating a relatively positive performance on average. The standard deviation of around 2.7% suggests that while the returns have some variability, they are not excessively volatile. The proximity of the median to the mean implies a balanced distribution of returns.
The range of 8.3% underlines the potential for varying performance levels, while the minimum return of -2.1% points to the portfolio’s weakest month. On the other hand, the maximum return of 6.2% highlights a strong month for the portfolio.
In financial terms, these descriptive statistics help investors understand the portfolio’s risk and return characteristics, aiding in decision-making and risk.
Further Learning:
- Status Bar Metrics
- 3 Easy Methods to Count Unique Values in Excel
- How to Convert Text to Numbers in Microsoft Excel
Click here to learn more about Analysis ToolPak in Excel!
John Michaloudis is a former accountant and finance analyst at General Electric, a Microsoft MVP since 2020, an Amazon #1 bestselling author of 4 Microsoft Excel books and teacher of Microsoft Excel & Office over at his flagship MyExcelOnline Academy Online Course.


