When working in Excel, I often find myself relying on tables to organize and analyze data more efficiently. Tables in Excel are powerful tools that allow me to sort, filter, and calculate data with ease. In this article, I’ll guide you on how to draw table and show you how to make the most of them in your work. Whether you’re managing a small dataset or a large project, Excel tables can simplify your tasks and enhance your productivity.
Key Takeaways:
- Draw table to transform static data ranges into dynamic, manageable systems.
- Tables enhance formula clarity by using structured references, making data easier to interpret.
- Customizing table styles and preferences can improve data readability and efficiency.
- Excel tables automatically adapt to changes, keeping formulas and formatting consistent.
- Knowing how to troubleshoot and manage tables ensures you stay in control of your data.
Table of Contents
Introduction to Excel Tables
The Value of Using Tables in Excel Data Management
Working with tables in Excel enhances data management by transforming static grids into dynamic, organized systems. Each table acts like a team, handling specific data segments, which improves efficiency. Excel’s structured references make formulas clearer by using table names instead of traditional cell references, easing the process of editing and interpreting complex data.
Additionally, data validation within tables ensures integrity by restricting input types and reducing errors. Excel continually reveals new utilities through its table features, making the creation of purpose-driven tables a foundational skill for effective data organization and analysis.
Understanding the Basics Before You Begin
Mastering Excel tables starts with understanding what sets them apart from regular cells. Excel tables are defined data sets with built-in features like auto-expanding ranges and special filters that streamline data management. These tables offer tools for efficient data handling directly within their context, making the transition from regular data management seamless.
Familiarizing yourself with the Table Tools menu, which appears when a table is selected, is essential. To avoid issues when creating tables, ensure your data is free of merged cells and organized into contiguous rows and columns for smooth workflow integration.
Creating Your First Table
Steps to Draw Table
Converting data into an Excel table is straightforward once I’ve prepped the dataset. Here’s how I walk through the transformation:
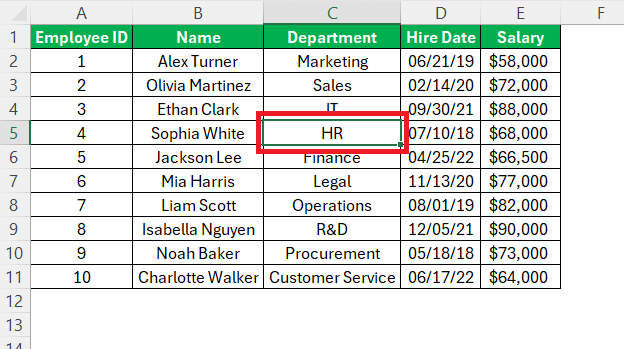
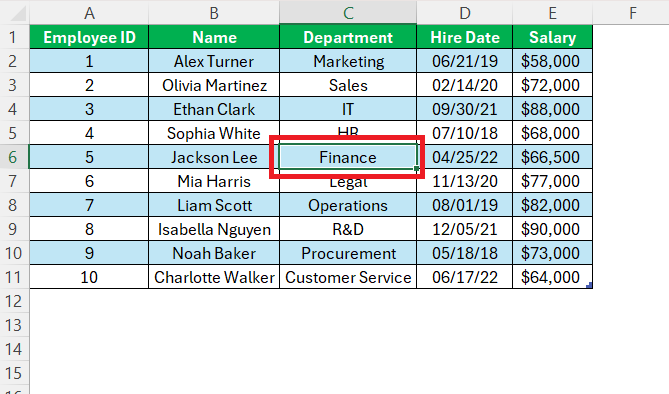
STEP 1: Start by clicking on any cell within the range of data. It could be in the middle of the dataset or any corner—it doesn’t matter as long as it’s within the range intended to convert into a table.
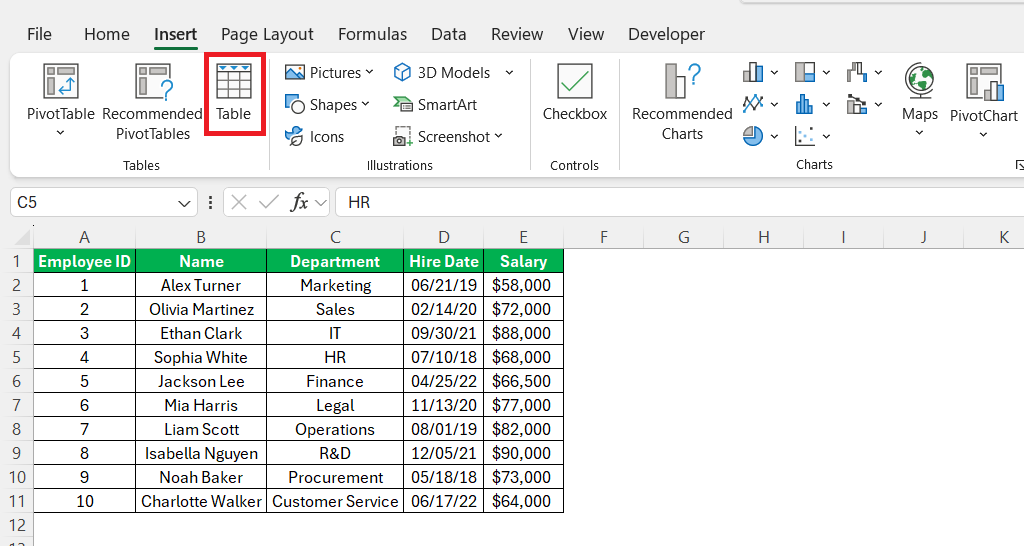
STEP 2: Head over to the ‘Insert’ tab and look for the ‘Tables’ group. Here, you’ll find the ‘Table’ button. Alternatively, the keyboard shortcut Ctrl + T directly opens the ‘Create Table’ dialog box.
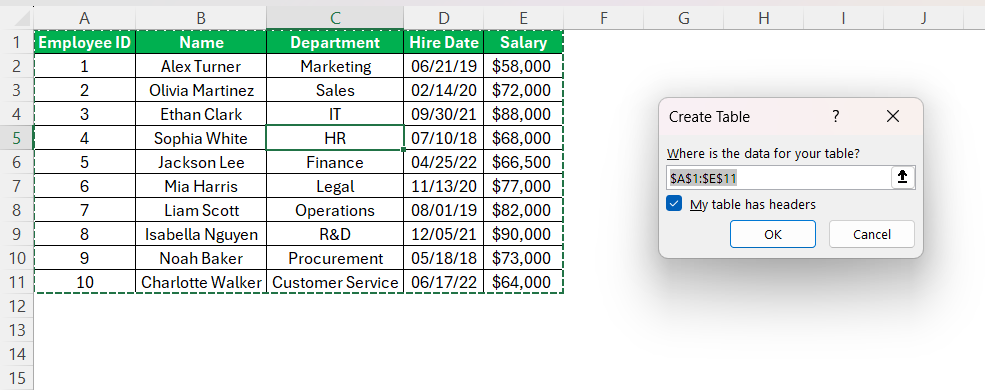
STEP 3: Before hitting ‘OK,’ check if the ‘My table has headers’ box is ticked. This distinguishes the first row as header names for table columns, which equates to field names in a database.
Excel often automatically selects all the related data around the selected cell. It’s good to glance over the marching ants or dotted lines enclosing the selected range in the dialog box to ensure everything is correct.
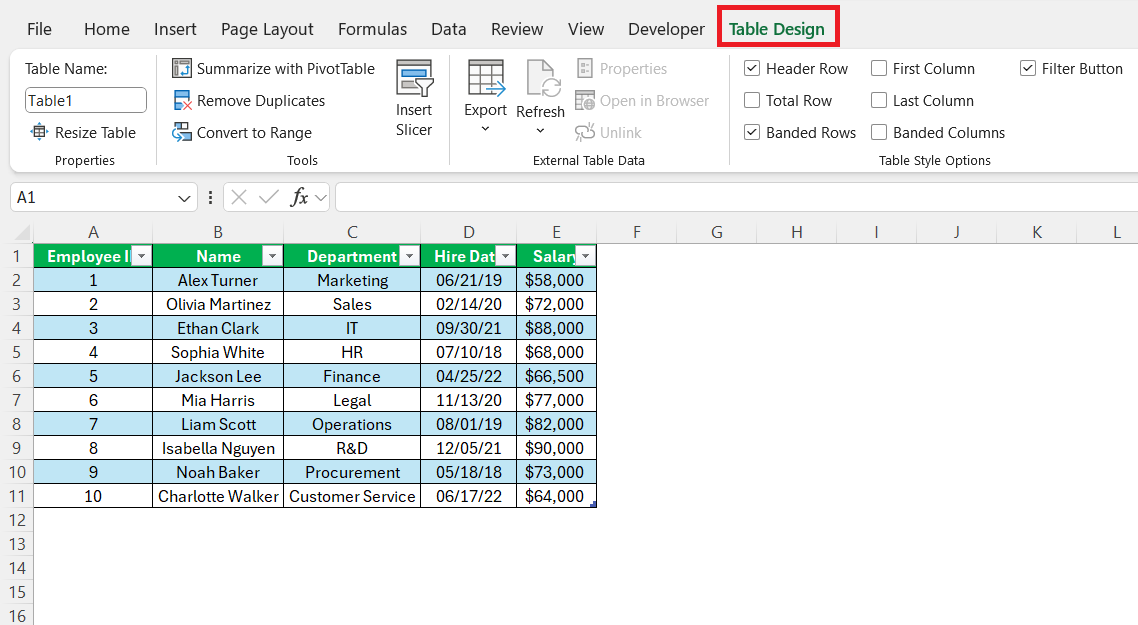
STEP 4: Once ‘OK’ is clicked, a beautifully formatted table springs to life, replacing what used to be a plain data range. Filters are at the top of each column, and through the ‘Design’ tab, more advanced table features can be tapped into.
It’s satisfying to see Excel work its magic—data organized, formulas updated, and the entire table ready to be manipulated further for deeper data analysis.
Customizing Table Preferences for Efficiency
Enhancing work efficiency with Excel tables involves customization. The ‘Table Tools Design’ tab provides an array of options to alter table preferences according to specific needs.
Here’s what I usually focus on:
- Table Style Options: These checkboxes allow toggling features like header row, total row, banded rows/columns, or filter buttons. I often enable banded rows to make data easier to read, whereas the total row feature saves time when quick summations or averages are needed at the end of a table.
- Table Styles: For a personalized touch or to adhere to company branding, a variety of table styles are available. The diversity of choices makes it easy to find one that suits the visual appeal aimed for.
- Resize Table: If the data range changes, the ‘Resize Table’ option efficiently adjusts the boundaries of the table accordingly, without reconstructing it from scratch.
In terms of efficiency, these small adjustments save not just seconds and clicks but also maintain uniformity across reports, making the data more digestible and less prone to misinterpretation by the end-user.
Advanced Table Techniques
How to Extend and Modify an Existing Table
Extending and modifying an existing table in Excel is necessary as data grows or changes. The process is intuitive and showcases Excel’s user-centric design.
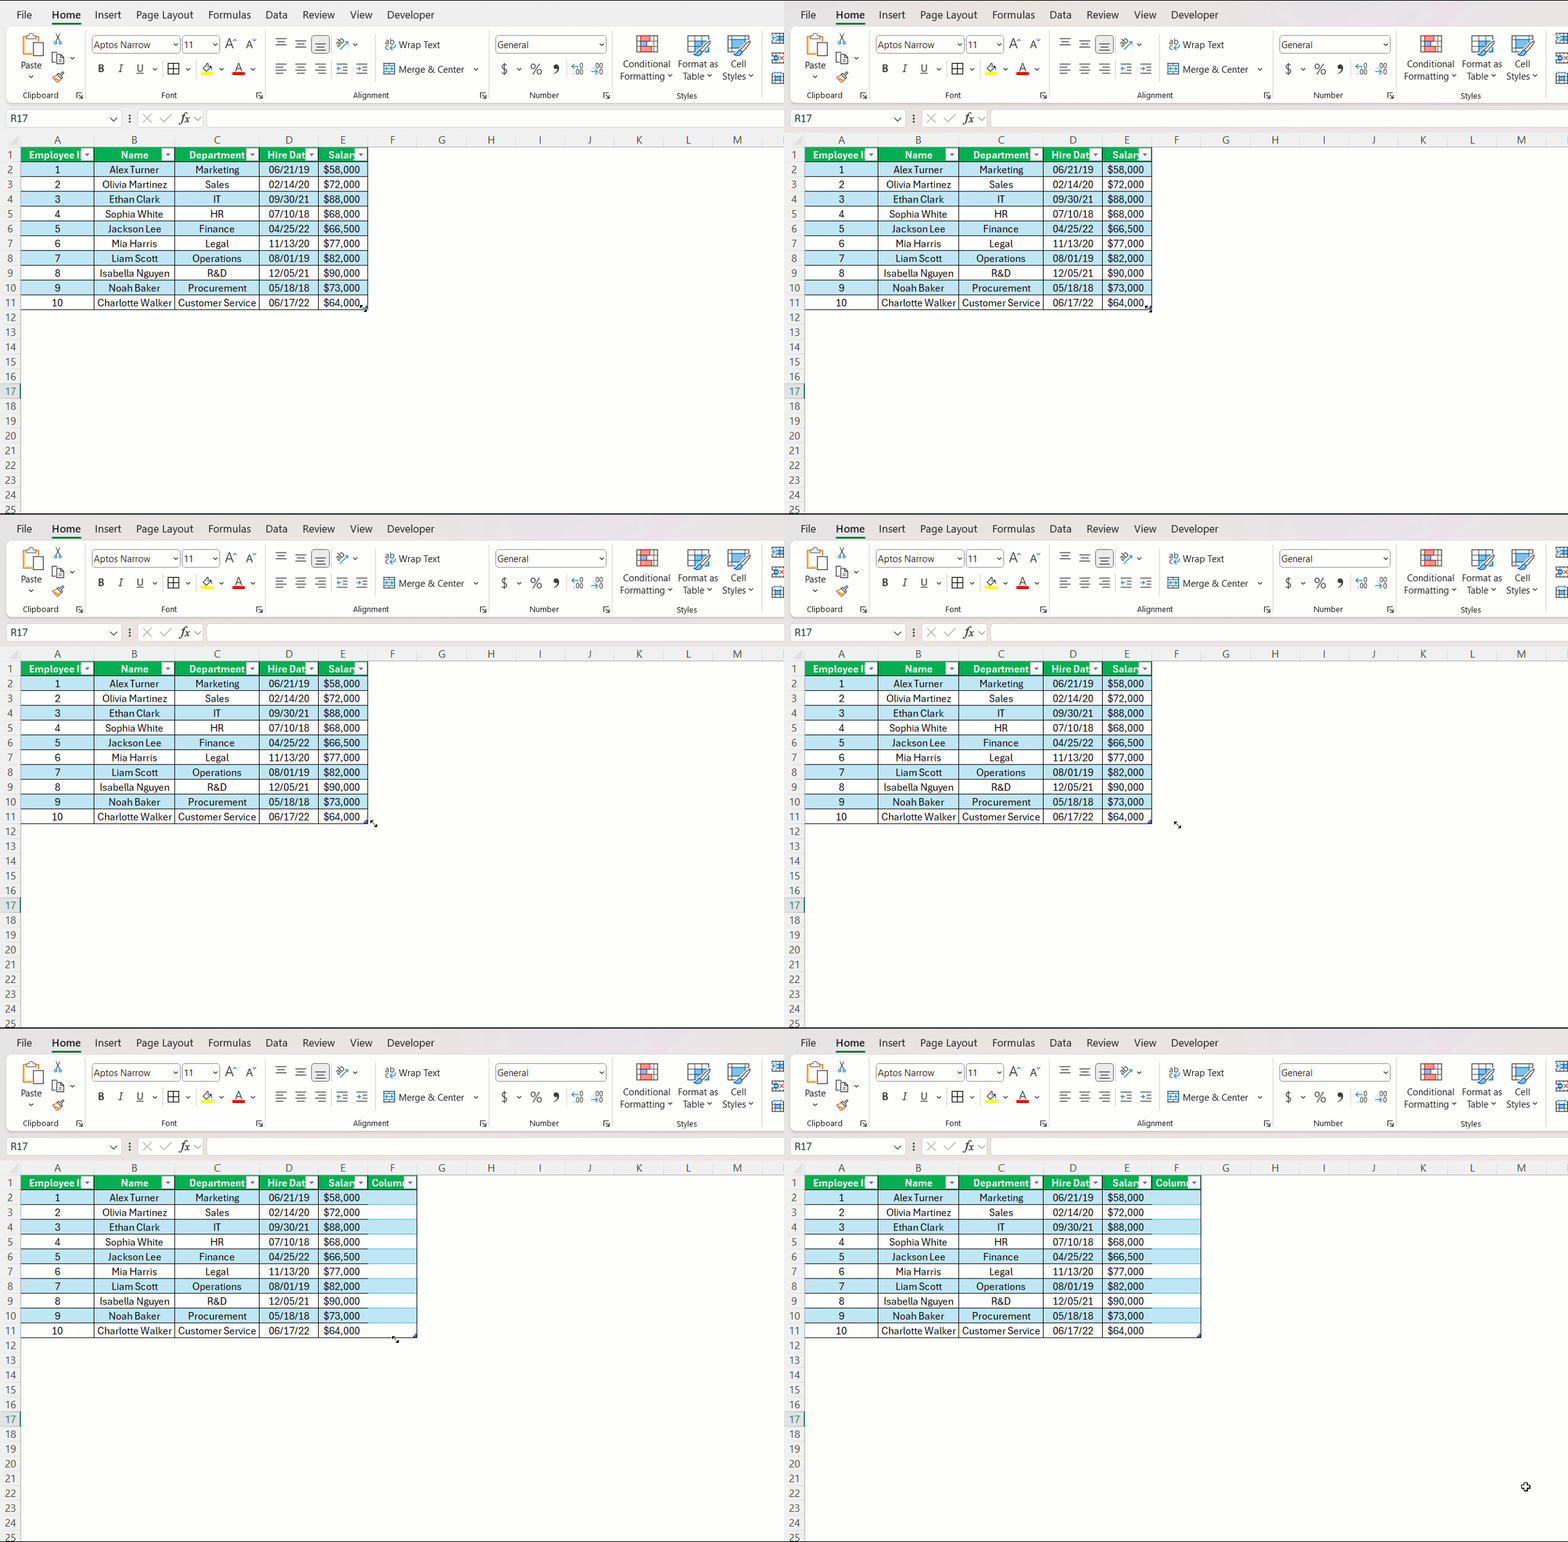
- Manually extending a table is as simple as dragging the handle at the bottom-right corner. Just click, and drag, and the table expands to include new rows or columns. However, Excel often automatically adjusts the table size as new data is typed into adjoining columns or rows.
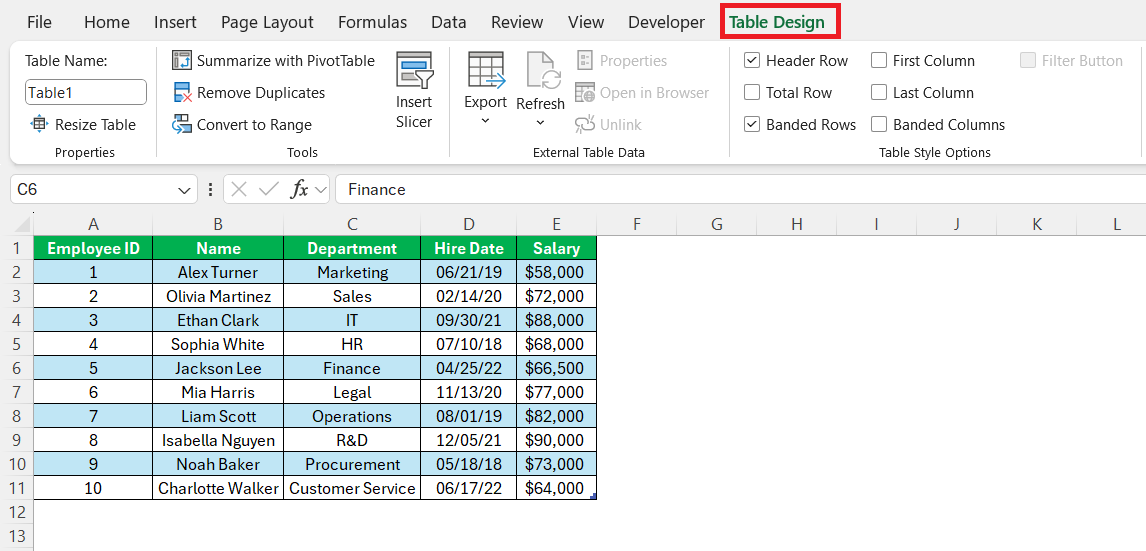
- Modifying a table is similarly straightforward. Click anywhere within the table to reveal the ‘Table Design’ tab. Within there, under the ‘Properties’ group, the ‘Resize Table’ button allows redefining the range of the table. Hit ‘OK,’ and the table dimensions are updated.
Adding and removing rows and columns works like in regular spreadsheets, with the added benefit that table formulas and formatting automatically adapt to these changes. This ensures that the table remains functional and visually consistent even as its contents evolve.
Implementing Formulas Within Tables for Dynamic Data
Working with formulas in Excel tables enhances efficiency, enabling dynamic data handling. As a formula is inputted in one cell within a table column, Excel automatically replicates it down the entire column.
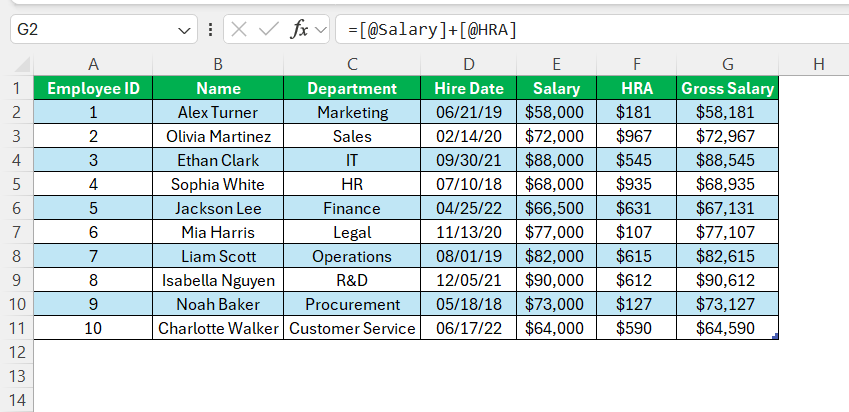
The structured references used in these formulas replace traditional cell references with table column names, making it easier to understand what the formula is calculating. For example, instead of using =E2+F2, I can write =[@Salary]+[@HRA], which is more intuitive and less prone to errors.
These formulas dynamically adjust when the table structure is altered, such as renaming a column or adding more data. This capability ensures that the formulas remain accurate and relevant as the data evolves.
Excel Table Troubleshooting
How to Remove or Convert a Table Back to Range
Situations arise where the structure of a table is no longer necessary, and converting it back to a regular range is needed. The process is straightforward, and Excel ensures no data is lost in the transition.
To convert a table to a range:
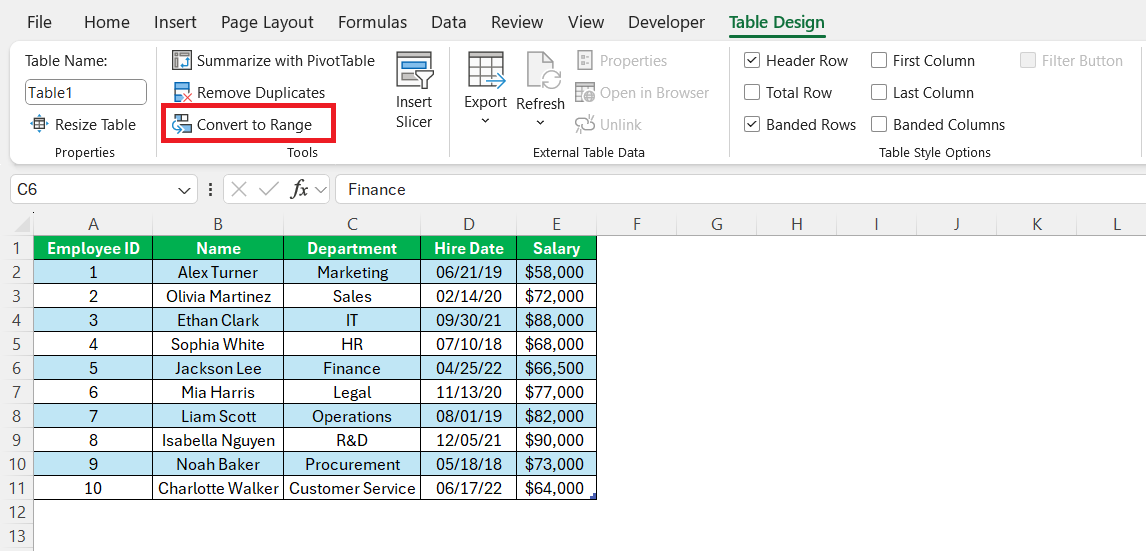
STEP 1: Click anywhere within the table to select it.
STEP 2: Navigate to the ‘Table Design’.
STEP 3: Click the ‘Convert to Range’ button in the ‘Tools’ group.
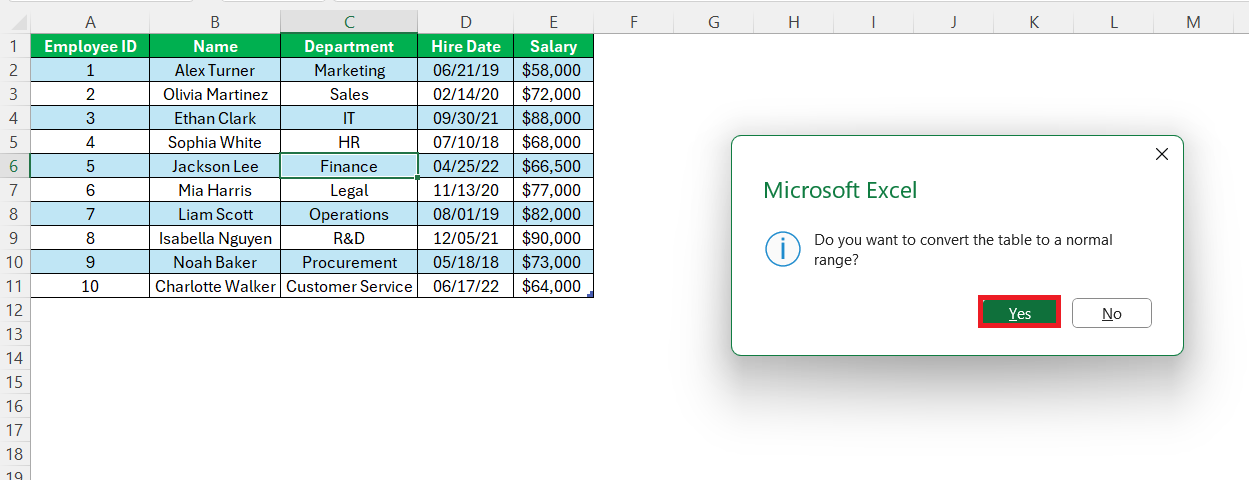
STEP 4: Confirm by clicking ‘Yes.’
Even after converting to a range, the data and formatting remain intact, though the auto-expand features and structured references linked to the table functionality are no longer active.
It’s these simple yet powerful features that have me advocating for Excel tables as one of the best data management tools in any analytical toolkit.
Resolving Common Issues with Table AutoExpansion
AutoExpansion is a nifty feature of Excel tables—usually. It’s like an invisible helping hand, stretching the table to make room when new data appears on the fringes. However, when I want to add data adjacent to a table without including it in the table, it can be a bit too zealous.
To tame this feature, there are two avenues that I’ve utilized:
- Undo the Expansion: If I accidentally extend a table by typing in new data directly below it, a swift ‘Ctrl + Z’ is my go-to action. This does the trick, retracting the table borders but keeping the new data intact.
- Manual Table Management: When I regularly work with adjacent data, I turn to manual table management. By clicking any cell within the table and selecting ‘Resize Table’ from the ‘Design’ tab, I can explicitly set the table boundaries. This gives me control, not automation, over where my table starts and ends—which is exactly what I need in certain situations.
Regardless of how I proceed, being aware of how AutoExpansion works ensures that I remain in the driver’s seat of my data narrative, not Excel.
FAQ Section
How do you draw a table with a pencil in Excel?
In Excel, the phrase ‘draw a table‘ typically refers to creating one electronically rather than by hand. However, if I’m looking to design a table that looks hand-drawn like penciled in, I would use Excel’s cell borders feature. Here’s a succinct overview: I select the range of cells for my table, navigate to the ‘Home’ tab, and in the ‘Font’ group, I click on the ‘Borders’ dropdown. I choose ‘Draw Borders’ for a custom look, which allows for a stylized, hand-drawn border around my cells.
How do you draw rows in Excel?
To add rows to an existing table in Excel, I simply click on the spot where I want the new row to appear and right-click. From the context menu, I choose ‘Insert’. If the table is uniquely formatted, Excel will automatically extend the table’s formatting and formulas to the new row. Adding plain rows outside of a table format involves selecting where the row should go, right-clicking, and choosing ‘Insert’ to slide in a new row above the selected cell.
How can you apply a specific table style in Excel?
To apply a specific style in Excel, I first click on a cell within the table to make the ‘Design’ tab appear. Then, in the ‘Table Styles’ group, I click the style I want. For more options, I click the ‘More’ button in the bottom right corner of the styles gallery. If I need to make it the default style for future tables, I right-click the desired style and choose ‘Set as Default’.
What are the steps to remove table formatting while retaining data?
To remove table formatting and keep the data intact, here’s what I’ve done: After clicking on a cell within the table, I go to the ‘Design’ tab. Then, under the ‘Table Styles’ group, I click on the ‘More’ button and choose ‘Clear’ to remove built-in styles. Before converting to a range, using ‘Clear Formats’ under the ‘Home’ tab ensures all formatting is wiped, leaving just the raw data.
Can you sort data within a table, and how is it different from sorting regular data ranges?
Yes, sorting data within a table is straightforward: I click on the drop-down arrow in the header row and select my preferred sorting order. What’s distinct in tables is that sorting is contextual with easy-to-access headers, and the sort state can be easily reversed or adjusted. Plus, it doesn’t affect the sorting of adjacent data, which often happens with regular data ranges.
John Michaloudis is a former accountant and finance analyst at General Electric, a Microsoft MVP since 2020, an Amazon #1 bestselling author of 4 Microsoft Excel books and teacher of Microsoft Excel & Office over at his flagship MyExcelOnline Academy Online Course.

