Excel remains a cornerstone in data management and analysis, making it crucial for users to understand how to edit data table efficiently. This guide focuses on the fundamental skills needed to master data table editing in Excel, with a strong emphasis on practical steps to enhance your efficiency and accuracy. Leveraging these skills not only bolsters capabilities in Excel but also transforms data into actionable insights.
Key Takeaways:
- Excel data tables enable dynamic “What-If” analysis by adjusting input values to observe changes in results.
- In financial modeling, data tables help simulate multiple scenarios, aiding in better decision-making.
- Editing tables efficiently involves resizing, modifying data points, and using validation tools for accuracy.
- Advanced techniques like macros and pivot tables enhance automation and data analysis capabilities.
- Utilizing shortcuts, named ranges, and protected sheets improves workflow efficiency and minimizes errors.
Table of Contents
Understanding Excel Data Tables
What Are Data Tables?
Data tables in Excel serve as dynamic tools designed for ‘What-If’ analysis, allowing users to explore the effects of changing input values on their formulas. These tables streamline the process of examining various scenarios, particularly when working with complex formulas dependent on multiple variables.
Unlike standard Excel tables, which organize data systematically, data tables focus on testing different datasets to observe potential impacts on results. They can be configured to accommodate either single or dual-variable analysis, providing flexibility to adapt to different modeling needs.
Importance in Financial Modeling
In financial modeling, data tables stand as indispensable tools facilitating thorough analysis and decision-making. Their primary advantage lies in their ability to simulate multiple financial outcomes simultaneously by varying input factors like interest rates, investment amounts, or loan terms.
This capability to efficiently conduct sensitivity analysis aids in forecasting financial performance and planning under varied conditions. For example, by altering expense forecasts or sales figures in a data table, analysts can anticipate the effects on net income or cash flow projections. Thus, they empower better strategic decisions by providing a clearer picture of financial realities.
Step-by-Step on How to Edit Data Table
Adjusting Table Size and Structure
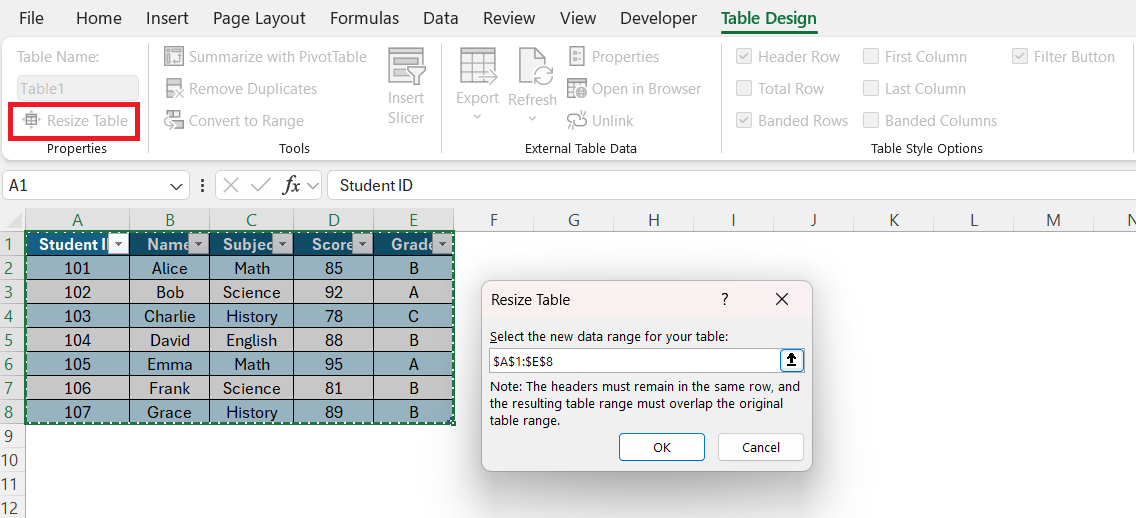
Adjusting the size and structure of your data table in Excel is a straightforward process that allows for increased flexibility and better data representation. To modify the size, you can easily add or remove rows and columns. Click anywhere within the table to activate the “Table Design” tab.
From there, select “Resize Table” and define the desired range of cells, starting from the upper-most cell.
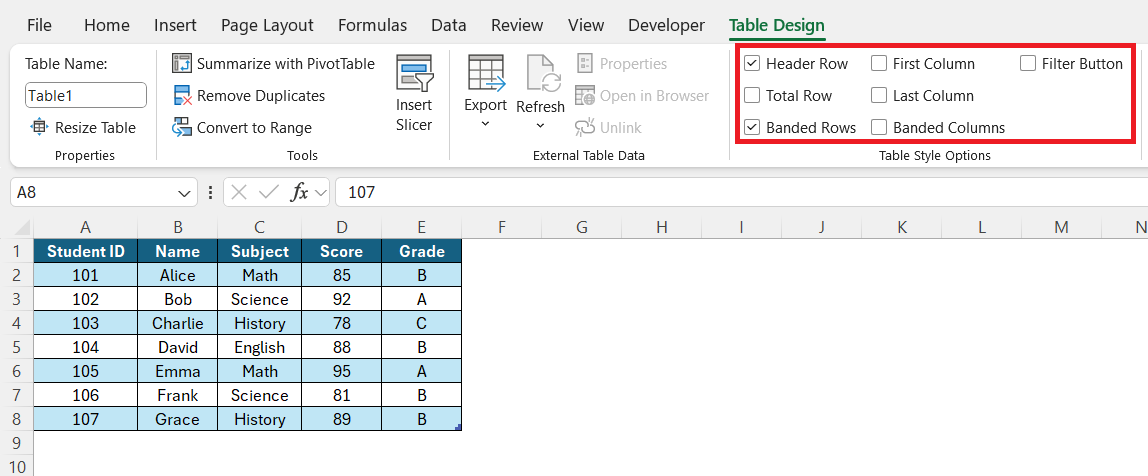
This adjustment accommodates additional data or refines existing data sets without disrupting the overall layout. When changing the structure, consider using Excel’s features like the header row, total row, and special formatting for key columns.
These enhancements not only make the table aesthetically pleasing but also improve its functionality.
Modifying Data Points
To maintain data accuracy in Excel, knowing how to modify data points safely is essential. Begin by selecting the cell or range of cells you wish to adjust. Directly typing in the new value or formula is often the quickest way to update. For more comprehensive changes, the ‘Find and Replace’ feature is invaluable. It allows batch adjustments across the dataset, saving time and minimizing errors.
Additionally, ‘Data Validation’ can be employed to restrict inputs to specific criteria, ensuring consistency throughout your table.
If your data table includes formulas, remember that modifications may impact dependent values, making it crucial to check any linked cells post-update. Use the ‘Trace Dependents’ feature to track how changes affect your table and associated calculations.
Tips for Efficient Editing
Enhancing your data table editing efficiency in Excel involves utilizing shortcuts, and predefined tools, and setting up a workspace tailored to your workflow needs. Here are several tips to streamline your editing process:
- Keyboard Shortcuts: Master frequently used shortcuts such as Ctrl+C (copy), Ctrl+V (paste), and Ctrl+Z (undo). These save invaluable time when making quick edits.
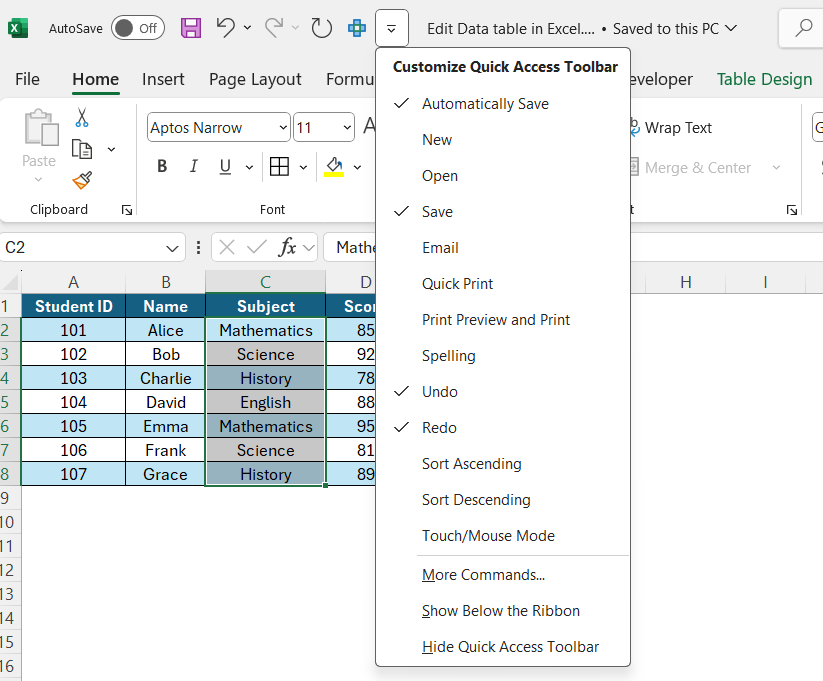
- Use the ‘Quick Access Toolbar’: Customize this toolbar with the tools you use most frequently, ensuring they’re always within easy reach.
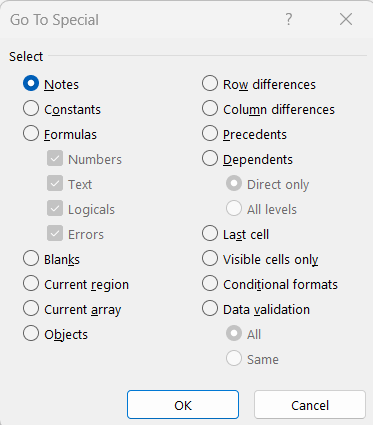
- Excel’s ‘Go To Special’ Feature: Access this via F5 > Special, and use it to quickly select cells meeting specific criteria, such as blanks or cells with errors.
- Named Ranges: Simplify navigation and data management by using named ranges in your formulas instead of cell references.
- Protected Sheets: Protect sheet functionality to prevent accidental modifications of critical data, while still allowing essential changes to be made in designated areas.
These techniques not only speed up standard workflows but also significantly reduce the likelihood of errors emerging during the editing process.
Advanced Editing Techniques
Using Macros for Automation
Macros in Excel are powerful tools that automate repetitive tasks, significantly enhancing productivity. By recording a sequence of actions, macros enable you to execute complex operations with a single command. To create a macro, navigate to the “Developer” tab, and click on “Record Macro.”
As you perform the desired task, Excel records each step. Once finished, stop the recording and save the macro for future use.
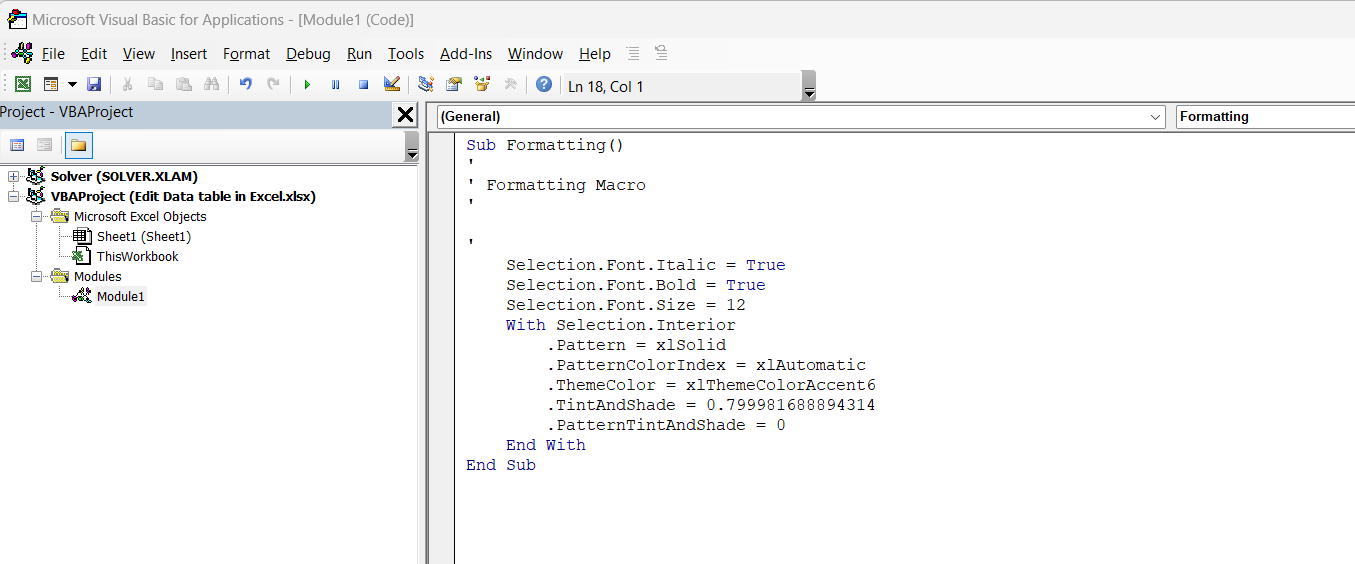
Using macros is especially beneficial for tasks like formatting tables, generating reports, or applying consistent data transformations across multiple sheets. For advanced users, editing macro scripts via the Visual Basic for Applications (VBA) editor allows for more customized automation tailored to specific needs.
However, it’s crucial to test macros in a backup file first, as automated actions cannot be undone easily. Ensuring your macros don’t contain sensitive data or links that could become obsolete is key to maintaining file integrity over time. Properly managed, macros transform tedious processes into swift and consistent operations.
Integrating Pivot Tables
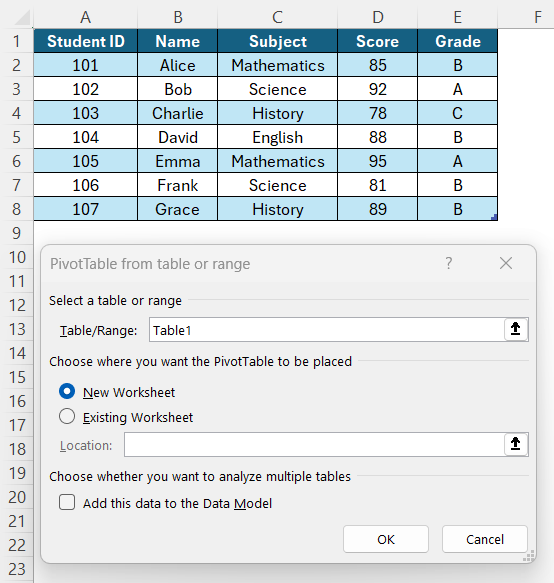
Integrating pivot tables with your data tables in Excel opens up sophisticated data analysis capabilities, enabling you to summarize, sort, reorganize, and filter information effortlessly. Start by selecting the data table you want to analyze, then go to the “Insert” tab and click “PivotTable.”
In the ensuing dialog box, confirm your selection and choose a location for the pivot table, which could be in a new or existing worksheet.
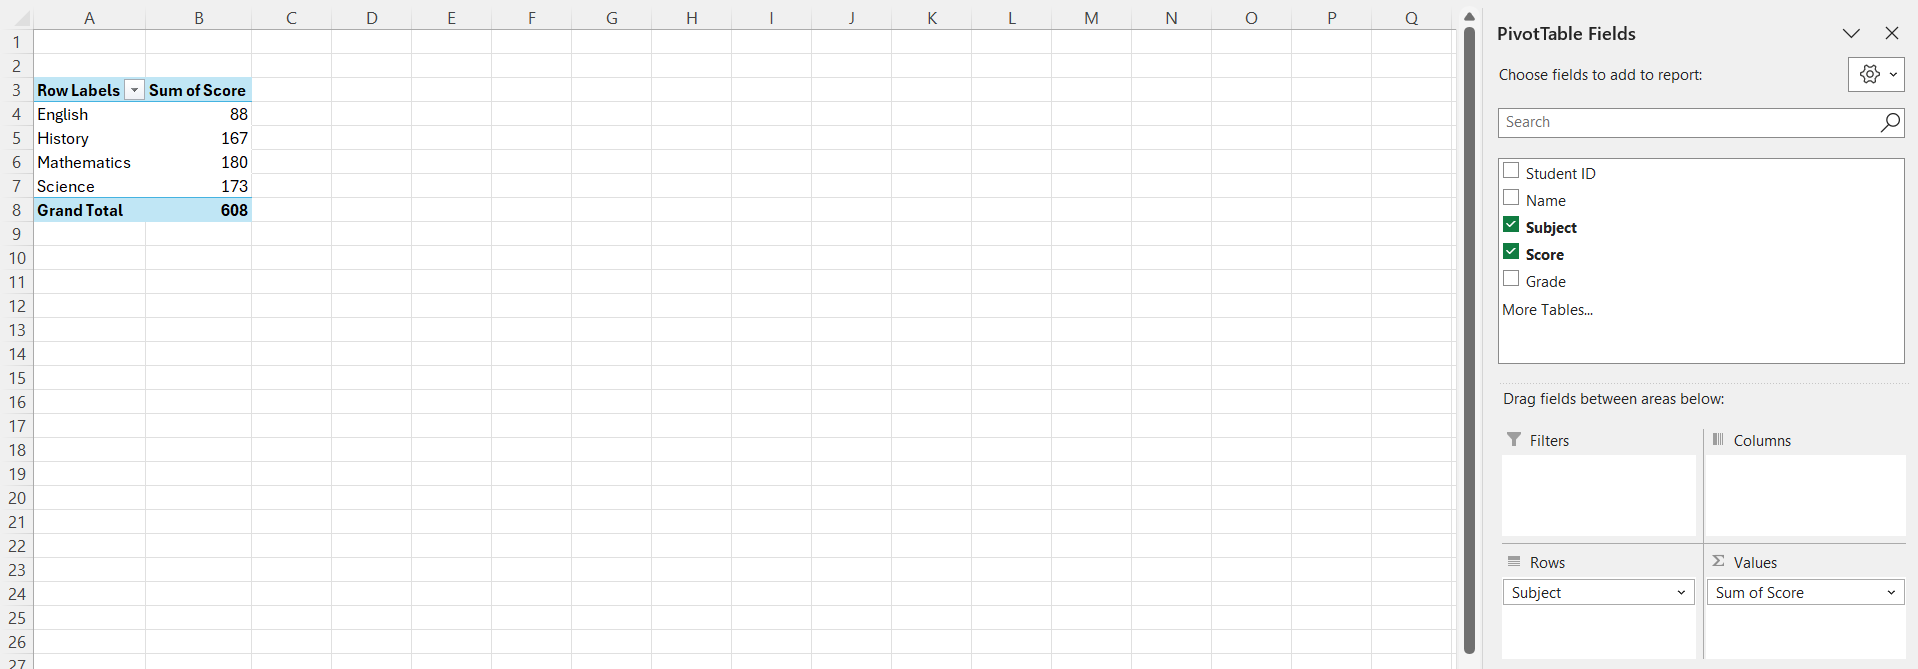
Once created, the pivot table field list lets you drag fields to the Rows, Columns, Values, and Filters areas. This setup provides diverse views of your data, letting you produce detailed reports and actionable insights.
As with standard tables, ensure data integrity before creating pivot tables, as they mirror the source data.
FAQs
How do I change the data table in Excel?
To change a data table in Excel, click on any cell within the table to bring up the Table Design tab. From there, adjust the size by using the corner handles, or add new rows and columns. You can also modify cell values directly or utilize Excel features like ‘Find and Replace’ for batch updates.
How can I add a formula to a data table?
To add a formula to a data table in Excel, click on a cell within your table where you want the formula, enter your desired formula, and press Enter. If you wish to apply this formula to the entire column, grab the fill handle (a small square at the bottom-right corner of the cell) and drag it down through the cells in that column.
What should I do if my data table isn’t updating?
If your data table isn’t updating, first ensure that the workbook calculation settings are set to “Automatic” except for data tables under File > Options > Formulas. Check that input cells are correctly linked and not switched, and verify the table is on the same worksheet as its inputs.
How do I delete unwanted rows or columns from a data table?
To delete unwanted rows or columns from a data table in Excel, right-click on the row or column header you wish to remove. Select “Delete” from the menu and then choose “Table Rows” or “Table Columns” as appropriate. The data table will automatically adjust to reflect these changes.
How do I edit an existing table in Excel?
To edit an existing table in Excel, click within the table to activate the Table Design tab. Here, you can adjust the table’s size by resizing it using corner handles or the Resize Table option. You can also update data directly in the cells, apply conditional formatting, or modify the table style for enhanced readability.
John Michaloudis is a former accountant and finance analyst at General Electric, a Microsoft MVP since 2020, an Amazon #1 bestselling author of 4 Microsoft Excel books and teacher of Microsoft Excel & Office over at his flagship MyExcelOnline Academy Online Course.


