The Excel ROWS function is a powerful yet often underutilized tool that enhances efficiency when dealing with large datasets. Whether you’re a seasoned Excel user or just beginning your journey, understanding how this function fits into the broader scope of spreadsheet management can significantly boost your productivity. This guide delves into the nuances of the ROWS function, offering insights into its practical applications, tips for optimal use, and solutions to common issues.
Key Takeaways:
- The ROWS function in Excel counts the number of rows in a specified range, making it useful for data analysis.
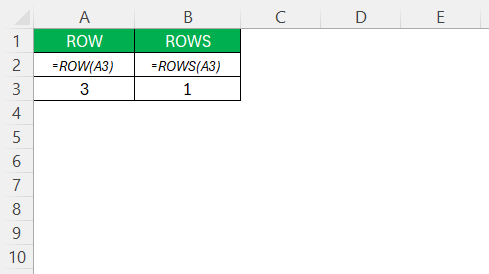
- It differs from the ROW function, which returns the row number of a single cell rather than the total count of rows.
- The ROWS function can be combined with other functions like SUM and AVERAGE for dynamic calculations.
- It enhances efficiency in large datasets and can be integrated with conditional formatting for better visualization.
- Best practices include using named ranges, verifying data consistency, and ensuring correct range selection to avoid errors.
Table of Contents
Understanding the Excel Rows Function
What is the ROWS Function?
The ROWS function in Excel is a versatile worksheet function designed to count the number of rows within a specified range. It serves as an integral component for those needing precise row information in a dataset.
The syntax of the ROWS function is simple yet effective. It follows the structure:
ROWS(array)
where “array” refers to the cell range or array for which you want to determine the number of rows. This argument can be specified by directly highlighting a set of cells or referring to a named range containing your data.
The function processes the input by counting each individual row within the defined array and returns the total count as a numeric value. Importantly, the specified array must be valid and contained within your worksheet to ensure accurate results. The straightforward nature of the syntax helps streamline implementation, allowing users to quickly gauge their dataset’s row count without complex formula construction.
Different from its cousin, the ROW function, which provides the specific row number of a single cell, the ROWS function returns an integer representing the total number of rows contained in a reference or array.
By employing this function, users can enhance their data analysis processes, ensuring they maintain accurate and efficient records.
Key Features and Benefits
The ROWS function boasts several key features and benefits that cater to a wide range of data management needs. Firstly, it is straightforward to use, requiring minimal effort to integrate into existing spreadsheets. This simplicity makes it accessible to users of varied skill levels. Secondly, the function allows for automatic row counting across diverse ranges, which is crucial for maintaining scalability and efficiency in data-heavy tasks.
Moreover, the ROWS function can be employed alongside other Excel functionalities, such as SUM and AVERAGE, to facilitate complex computations and analyses. Its ability to dynamically adjust to changes within the dataset ensures that row counts remain accurate even as data is added or removed. These features make the ROWS function an essential tool for optimizing spreadsheet operations, particularly in environments that demand regular data updates and precise numerical insights.
How to Use the ROWS Function
Basic Example
The ROWS function in Excel is a simple yet powerful tool that helps you find the number of rows in a given range. Whether you’re working on a large dataset or a basic spreadsheet, the ROWS function can make your task easier and more efficient. To effectively utilize the ROWS function, follow this step-by-step guide:
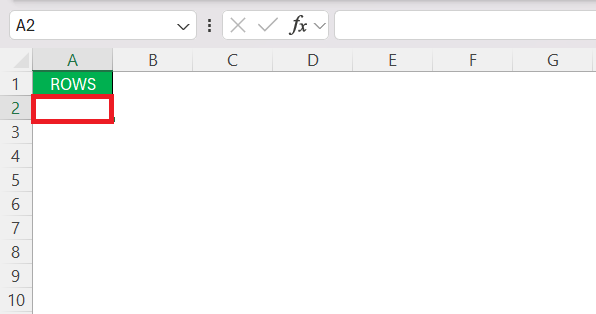
STEP 1: Open your Excel spreadsheet and select the cell where you want the result to appear.
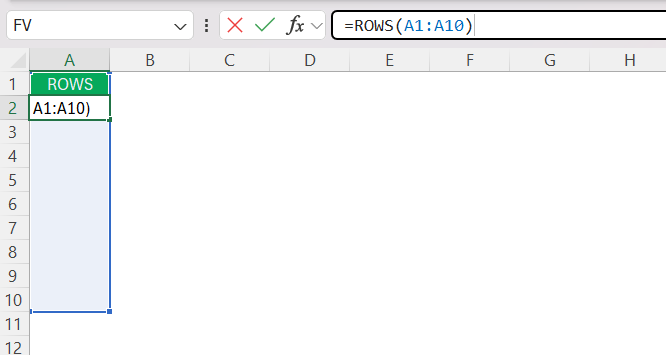
STEP 2: Enter the formula =ROWS(range) into the selected cell. Replace “range” with the actual range of cells you’re working on, such as A1:A10.
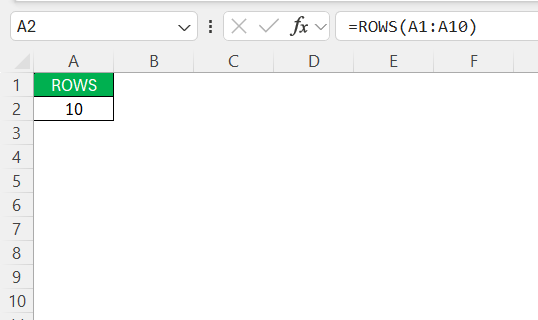
STEP 3: Press ‘Enter’ to execute the function. Excel will calculate and display the number of rows in the specified range in the cell where you entered the formula.
This straightforward step-by-step process helps Excel users efficiently determine row counts, which is especially useful for data validation, analysis, or when setting up repetitive tasks. With the ROWS function, you can make informed decisions based on your dataset’s structure. By following these steps, you ensure accuracy and efficiency in your Excel operations.
Combining with Conditional Formatting
Integrating the ROWS function with conditional formatting can enhance the visual clarity and analysis of your data. By creating dynamic formatting rules that react to row counts, you can emphasize key data insights effectively. Here’s a step-by-step guide on how to achieve this integration:
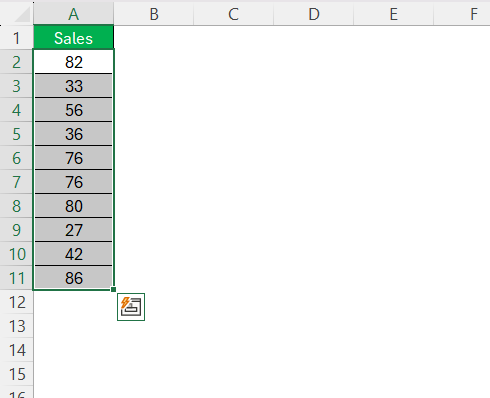
STEP 1: Select Your Data Range
Highlight the range of data where you want to apply conditional formatting, such as cells A1 through A10.
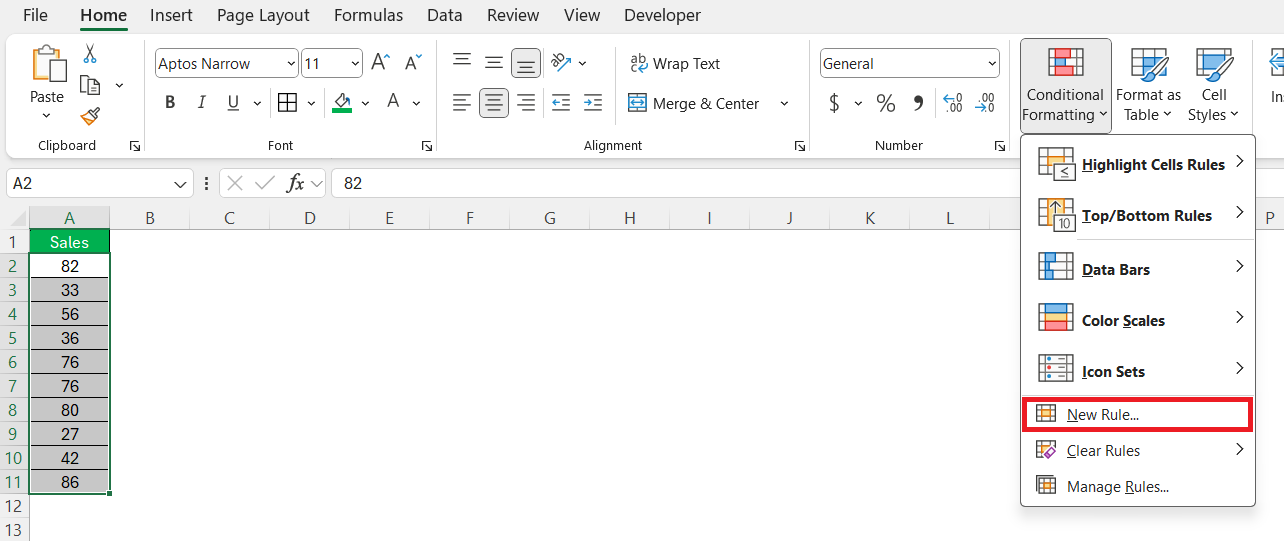
STEP 2: Open Conditional Formatting
Go to the Home tab on the Ribbon, click on Conditional Formatting, and choose New Rule.
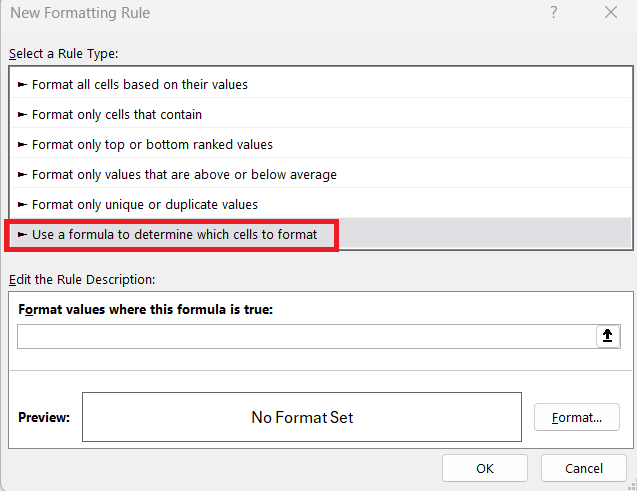
STEP 3: Choose Rule Type
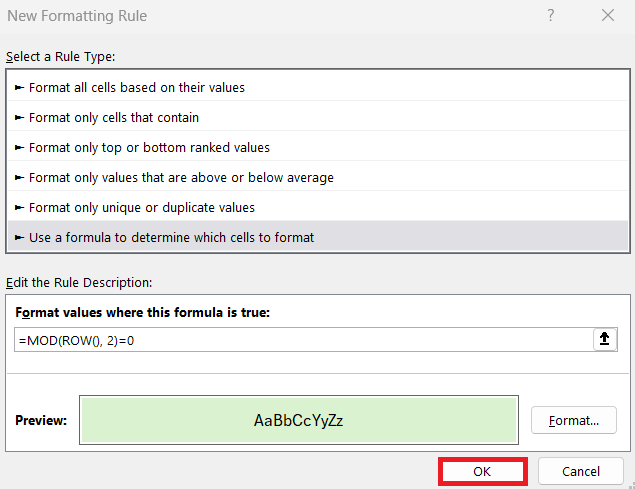
In the New Formatting Rule dialog box, select Use a formula to determine which cells to format.
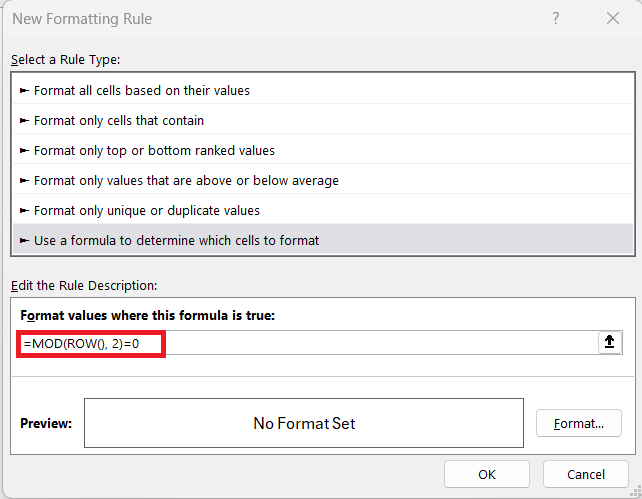
STEP 4: Enter the Formula
In the formula box, input an expression utilizing the ROW function. For example:
=MOD(ROW(), 2)=0
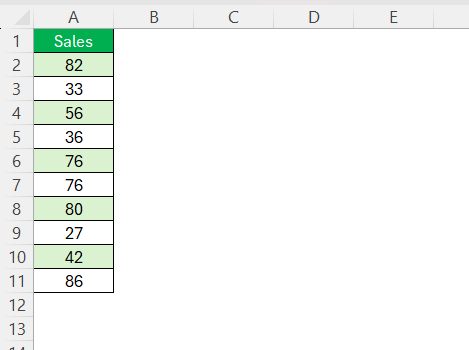
This formula applies formatting to even-numbered rows.
STEP 5: Set Formatting Style
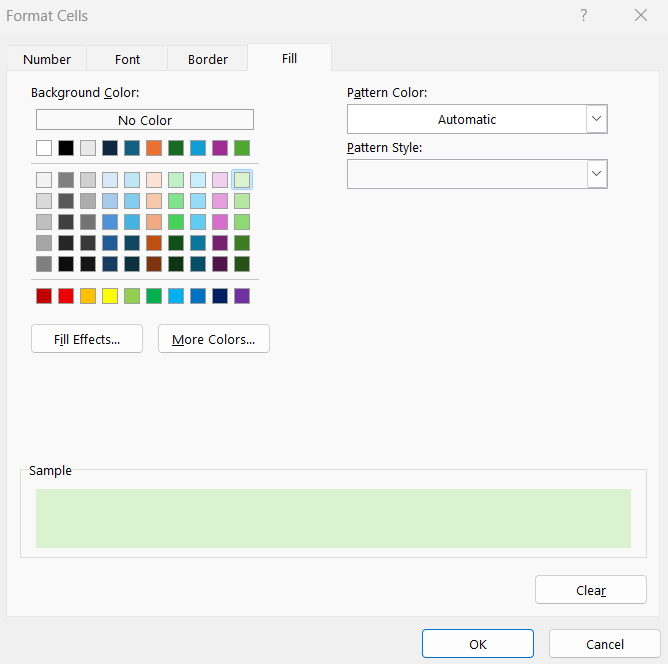
Click on the Format button and choose your desired formatting style, such as a fill color or text style, to highlight the selected rows.
STEP 6: Apply the Rule
Click OK to confirm and apply the rule.
Your specified rows should now display the chosen formatting based on the formula conditions.
This approach not only automates the process of highlighting important data but also makes it easier to spot trends and outliers within your dataset. Integrating the ROWS function in this manner supports a more dynamic and visually compelling data presentation.
Tips for Maximizing Efficiency
Achieving accuracy with the ROWS function involves following several best practices that enhance reliability and precision in your Excel applications:
- Correct Range Selection: Always ensure that the range specified in the ROWS function correctly reflects the dataset you aim to analyze. Double-check your cell references to avoid common errors caused by incorrect or incomplete range specifications.
- Use Named Ranges: Implementing named ranges improves formula readability and manageability, particularly in complex spreadsheets. By using names, you reduce the likelihood of miscounted or omitted data, thereby maintaining accurate row counts.
- Verify Data Consistency: Ensure uniformity in your dataset format. Irregular data arrangements or inconsistencies can lead to inaccurate row counts or misinterpretations of results.
- Combine with Data Validation: Employ data validation techniques alongside the ROWS function to control input values and preserve data integrity. This practice minimizes the possibility of errors affecting your row count outcomes.
- Stay Updated: Regularly update your Excel skills and software to take advantage of the latest features and improvements. Newer Excel versions may offer enhanced functionalities that can further improve the efficiency and accuracy of row counting.
By adhering to these best practices, you can optimize the use of the ROWS function, ensuring you consistently achieve accurate results and streamline your data management processes. These strategies foster precision in calculations, supporting effective decision-making and reporting.
FAQs
How does the ROWS function differ from the ROW function?
The ROWS function returns the number of rows in a specified range, while the ROW function provides the row number of a specific cell. Essentially, ROWS counts rows in a range, whereas ROW identifies the position of a single row.
Can the ROWS function be used with other functions like SUM or AVERAGE?
Yes, the ROWS function can be effectively combined with functions like SUM or AVERAGE to perform dynamic calculations. For instance, you can use it to calculate the average value in a dataset divided by the number of rows, ensuring automatic updates as the data range changes.
What are some common mistakes when using the ROWS function?
Common mistakes when using the ROWS function include referencing incorrect or incomplete range addresses, selecting column ranges instead of row ranges by accident, and failing to account for empty rows within the specified range, which can lead to inaccurate counts. Additionally, overlooking the need for dynamic range adjustments can result in outdated results as data changes.
How do you use the row function in Excel?
To use the ROW function in Excel, select the cell where you want the row number to appear and enter =ROW(reference)—specifying the cell or leaving it blank for the current cell’s row number. Press Enter to display the result, revealing the row number of the specified or active cell.
What is the rows function?
The ROWS function in Excel returns the number of rows in a given range or array. It’s used primarily for tasks that require precise row calculations within datasets, aiding in effective data management and analysis.
John Michaloudis is a former accountant and finance analyst at General Electric, a Microsoft MVP since 2020, an Amazon #1 bestselling author of 4 Microsoft Excel books and teacher of Microsoft Excel & Office over at his flagship MyExcelOnline Academy Online Course.

