When I first started using Excel, one of the most basic concepts I had to wrap my head around was the idea of a row. Rows are a fundamental part of how Excel organizes data, and once you understand them, working with spreadsheets becomes much easier. Let me explain to you in the simplest way possible – What is a Row?
Key Takeaways:
- Rows in Excel are horizontal, foundational structures for organizing data linearly, identified by numbers starting from 1.
- They store data in a sequential, left-to-right format, enabling easy interpretation and relationship maintenance across columns.
- Rows support formatting, height adjustments, hiding, merging cells, and data manipulation through copy-paste functions.
- Advanced features include dynamic ranges, grouping, custom views, and combining rows with functions like SUMIF for efficient data analysis.
- Keyboard shortcuts and efficient row selection methods improve navigation, organization, and manipulation in large datasets.
Table of Contents
What is a Row?
Defining a Row’s Role in Spreadsheets
In the realm of Excel spreadsheets, a row constitutes one of the foundational building blocks of data organization. Rows run horizontally across the worksheet and are designed to store and present information in a linear fashion.
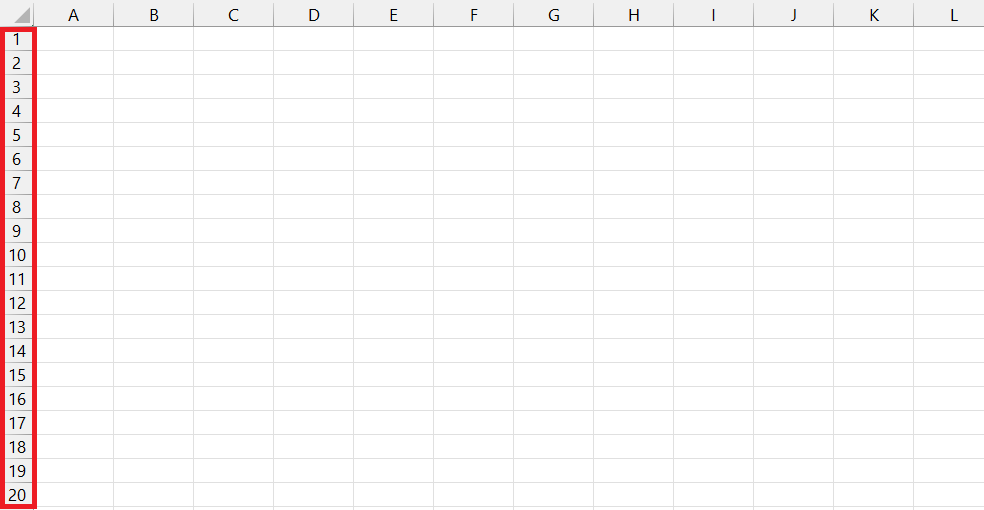
Each row is identified by a number, which is displayed on the left side of the sheet, starting from 1 at the top and increasing incrementally. This numerical labeling provides a quick reference for locating specific rows within the spreadsheet.
Rows accommodate the cell structure where data entries reside, thus playing a pivotal role in both the visual layout and the logical structuring of data within Excel.
Connection between Rows and Data Organization
Rows are instrumental in data organization within Excel, allowing us to input, read, and interpret information sequentially. They align data in a horizontal manner, which is not only intuitive for users familiar with reading from left to right but also helps maintain data relationships intact across different columns.
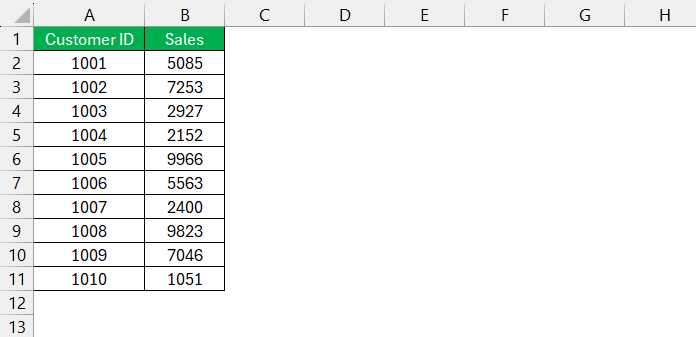
For instance, when we view a spreadsheet, each row can represent a unique record—like a particular customer’s details or a single transaction. All related information to that record is placed side by side within that row, offering a comprehensive overview at a glance.
Furthermore, rows offer flexibility in data categorization; by using different rows for different types of information, we interpret and analyze data sets more effectively. Moreover, the sequential arrangement in rows plays a significant part in performing tasks such as sorting and filtering, wherein the integrity of data relationships across the width of the spreadsheet is paramount.
Exploring the Functions of a Row
Basic Features of Excel Rows
Excel rows come packed with basic features that facilitate data entry and manipulation. When we talk about these features, the most prominent include:
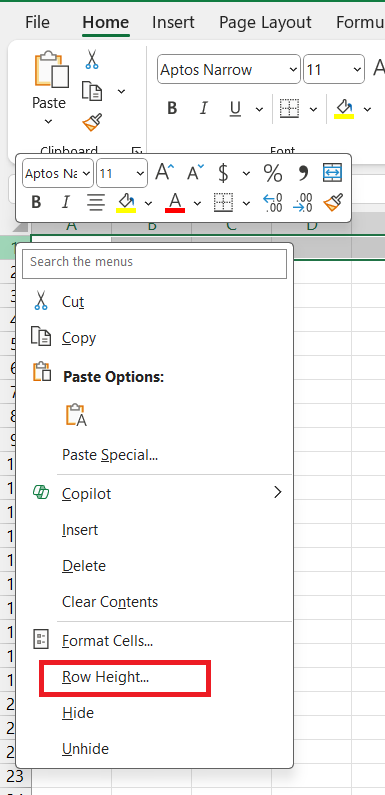
- Height Adjustment: The default height of an Excel row is set to accommodate the size of the font, but we can manually adjust the height to provide a better visual presentation or to accommodate more text.
- Formatting Options: Rows can be formatted collectively. For instance, we can apply the same font style, cell borders, or background color across all cells in a row for consistency and clarity.
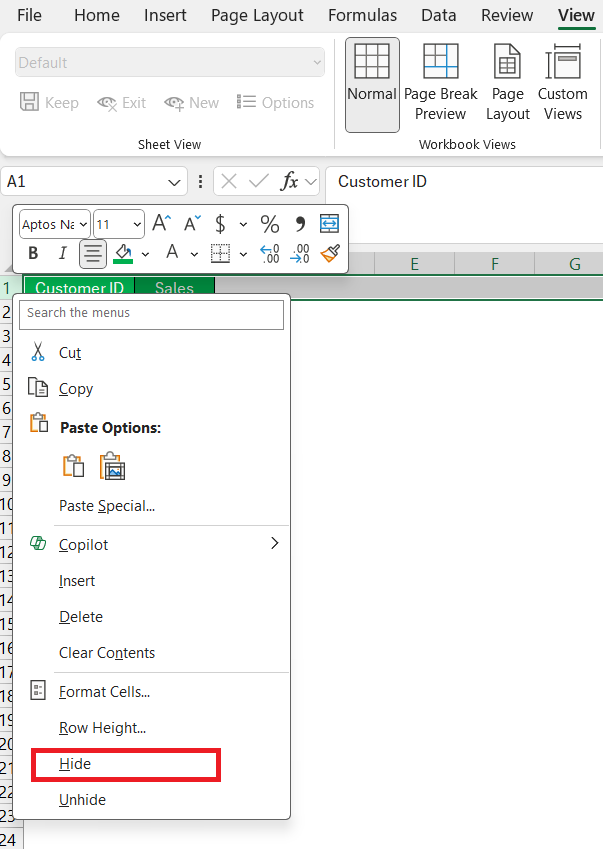
- Selective Row Hiding: At times, we may need to declutter our workspace by hiding rows that contain irrelevant or sensitive information, which can easily be done by right-clicking the row number and selecting ‘Hide’.
- Cell Merging: Within a row, adjacent cells can be merged to create a single larger cell, often useful for headers or grouping similar data.
- Copy & Paste Functionality: Entire rows can be copied and pasted, which is especially handy when duplicating data or templates throughout a spreadsheet.
- Data Grouping and Outlining: Group rows to create an outline structure you can easily expand or collapse, making it easier to navigate through different sections of your data set.
These basic features serve as the foundation for organizing data and creating user-friendly spreadsheets.
How to Manipulate Rows
Techniques to Insert or Delete Rows
Manipulating rows is a common task in Excel, and here’s how to insert or delete them effectively:
Inserting Rows:
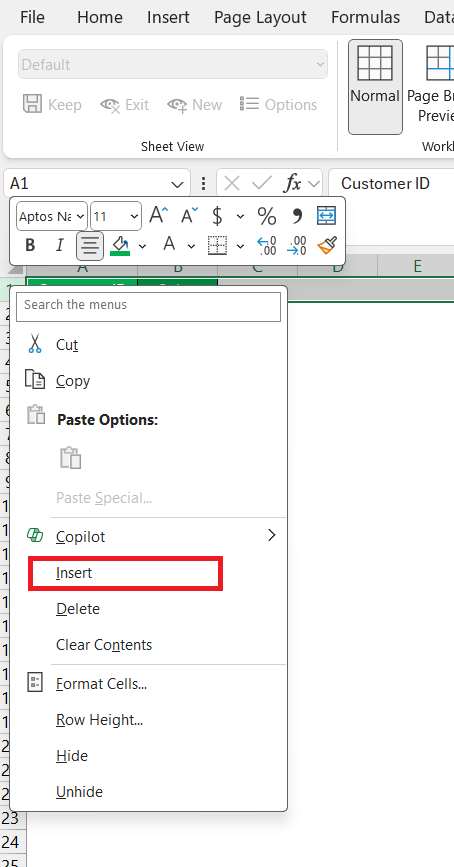
- To insert a single row, right-click the whole row directly below the desired location, select ‘Insert’, and a new row will appear above your selection.
- For inserting multiple rows, select the number of rows you want to add, right-click the selected area, and choose ‘Insert’. Excel will add that many new rows directly above your initial selection.
- Using the ribbon, click on any cell where you want to insert a new row, and navigate to Home > Insert > Insert Sheet Rows.
Deleting Rows:
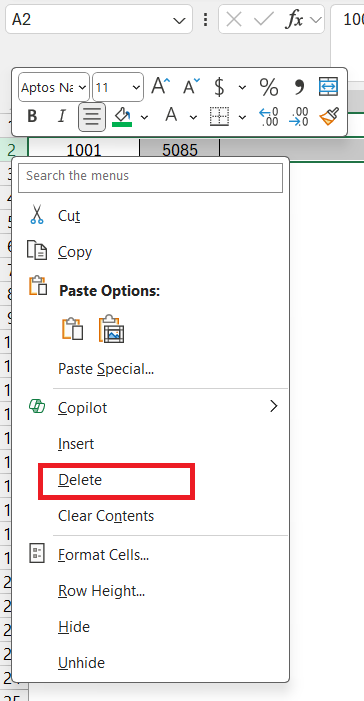
- To delete a row, click on the row number to highlight the entire row, then right-click and choose ‘Delete’.
- For deleting several rows, select them, right-click the selection, and then click ‘Delete’.
- The ribbon method involves selecting the row(s) you want to delete, then going to Home > Delete > Delete Sheet Rows.
Be cautious when inserting or deleting rows, as this may affect formulas or data references that span multiple rows.
Sorting and Filtering Data within Rows
Excel’s functionality shines brightly when we’re tasked with sorting and filtering data within rows to derive meaningful insights. Here’s how to leverage these tools:
Sorting Data:
- To quickly sort rows based on a specific column, click on the dropdown arrow in the column header and choose “Sort A to Z” for ascending order or “Sort Z to A” for descending order.
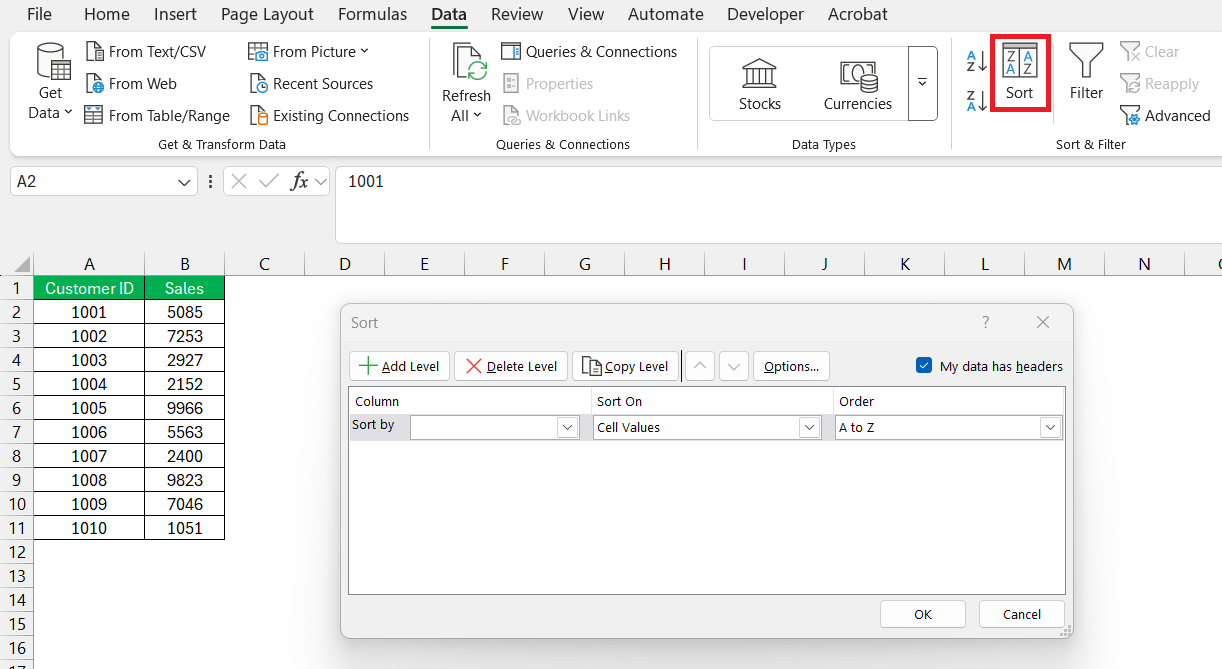
- For a custom sort, go to the Data tab and select “Sort”. This opens a dialog box where multiple levels of sorting criteria can be applied to the data, allowing for precise organization based on various factors.
Filtering Data:
- Filtering is incredibly useful for displaying only the rows that meet certain criteria. Click on the ‘Filter’ icon on the Data tab to toggle filters on and off.
- Once filters are applied to column headers, use the dropdown arrows to select the values that are relevant to your analysis. Excel will automatically hide rows that don’t match the criteria.
Both sorting and filtering can significantly enhance the readability of large data sets by organizing content according to the user’s specific needs and interests.
Operational Shortcuts Involving Rows
Keyboard Commands for Swift Row Navigation
When it comes to navigating through the dense labyrinth of data within Excel, keyboard commands are the express lanes that save us from the gridlock of mouse clicks:
- To leap to the last row of your dataset, simply press
Control + Down Arrow(Windows) orCommand + Down Arrow(Mac), whisking you to the edge of your data range. - If you crave a rapid return to the beginning,
Control + Up Arrow(Windows) orCommand + Up Arrow(Mac) serves as your quick ticket to the top, landing on the first row with data in the column you’re in.
These shortcuts are the cornerstones of spry row navigation, making the trip through rows not just a breeze, but virtually instantaneous.
Tips on Selecting Multiple Rows Efficiently
Selecting multiple rows efficiently is critical for performing batch operations such as formatting, deleting, or applying formulas. Here are some tips to streamline this process:
- To select contiguous rows, click the row number of the first row you wish to select, then hold down
Shiftand click the last row number in the sequence. This action highlights all rows in between. - For non-contiguous rows, use the
Ctrlkey (Command on Mac) to select multiple individual rows. Click the first row number, then hold downCtrland click additional row numbers at your discretion. - If you want to select all rows in your dataset swiftly, the shortcut
Ctrl + Shift + Spacebar(Command + Shift + Spacebar on Mac) is your go-to move once any single cell or row is selected.
Becoming adept at these strategies not only saves time but also reduces the risk of human error during data manipulation.
Frequently Asked Questions
What is a row in Excel?
In Excel, a row is a horizontal alignment of cells. Rows run left to right across the worksheet and are identified by unique numbers on the left. They’re fundamental for organizing data linearly and are referenced in formulas and for navigating through the spreadsheet.
What is row vs column?
A row in Excel spreads horizontally from left to right and is labeled with a number, while a column runs vertically, top to bottom, labeled with a letter. The main distinction is their orientation and how they structure data independently within a spreadsheet.
What Is the Maximum Number of Rows Allowed in Excel?
The maximum number of rows allowed in a single Excel worksheet is 1,048,576. This limit is standardized across all Excel spreadsheets and versions starting from Excel 2007 and onwards.
How Can You Quickly Add a Row Without Disrupting Formulas?
To quickly add a row without disrupting formulas, right-click on the row number below where you want the new row, then select ‘Insert’. Excel smartly adjusts formulas to account for the new row.
What does the rows function in Excel do?
The ROWS function in Excel counts the number of rows in a specified range or array, providing an integer that represents this count. It’s commonly used in formulas where the size of the range is variable or dynamic.
John Michaloudis is a former accountant and finance analyst at General Electric, a Microsoft MVP since 2020, an Amazon #1 bestselling author of 4 Microsoft Excel books and teacher of Microsoft Excel & Office over at his flagship MyExcelOnline Academy Online Course.

