Data forecasting in Excel is a powerful tool that helps businesses and individuals make informed decisions by predicting future trends based on historical data. Accurate forecasting is essential for effective budgeting, resource allocation, and market analysis, enabling organizations to anticipate changes and plan strategically. In this article, I will walk you through the process of extrapolating data in Excel with clear examples.
Key Takeaways
- Accurate forecasting is crucial for effective decision-making and resource management.
- Extrapolating in Excel allows you to predict future data points beyond the existing range.
- FORECAST and TREND functions are used for linear predictions, while GROWTH is for exponential trends.
- Choosing the right function depends on the data pattern and the nature of the forecast needed.
- Regularly updating forecasts with new data ensures that predictions remain accurate and relevant.
Table of Contents
Introduction to Data Forecasting in Excel
The Importance of Accurate Data Forecasting
Accurate data forecasting is crucial in decision-making processes across various industries. As a business, predicting product demand, budgeting, and planning resources hinge on the ability to reliably project future trends.
Excellent forecasts enable us to allocate resources efficiently, identify potential market shifts, and sidestep unforeseen financial dips or spikes. Essentially, it gives us the foresight needed to navigate the unknowns of tomorrow.
Overview of Extrapolation in Excel
Extrapolation in Excel is the technique of using known data sets to predict and estimate values beyond the data range. It’s analogous to extending a line on a graph beyond the plotted points. In Excel, this is achieved through various functions and tools that analyze the trends and patterns within existing data.
Whether we’re dealing with linear patterns or more complex relationships, Excel provides the flexibility to project likely scenarios, enabling us to forecast future data points with a degree of confidence.
Extrapolating in Excel
Extrapolation is different from interpolation, where interpolation estimates values within the range of the data set. Extrapolation, on the other hand, extends beyond the data range. For example, if you have sales data for the first nine months of the year, you can extrapolate to predict future sales. Below are the 3 methods that we can use to extrapolate data using Excel –
Extrapolation Using the FORECAST Function
The FORECAST function is primarily used to predict a future value along a linear trend by using existing values. It takes a single x-value and a set of known x-values and known y-values to predict the corresponding y-value. It’s typically used when you want to predict a single future value based on linear regression.
=FORECAST(x, known_y’s, known_x’s)
Step-by-Step Guide:
STEP 1: Enter the months in column A and sales figures in column B.

STEP 2: In cell A11, enter ’10’ for the month of October.

STEP 3: In cell B11, enter the formula: =FORECAST(A11, B2:B10, A2:A10) and press Enter.

Excel will forecast the sales for October based on the previous data.
Linear Extrapolation Using the TREND Function
The TREND function also predicts values based on a linear trend but is more versatile than FORECAST. It can return multiple predicted values for a series, not just a single point. It can take multiple x-values and return the corresponding predicted y-values, extending the trendline to as many points as needed.
=TREND(known_y’s, known_x’s, new_x’s, [const])
Step-by-Step Guide:
STEP 1: Enter the months in column A and sales figures in column B.

STEP 2: In cells A11, A12, and A13, type “10”, “11” and “12” respectively (for the month of October, November, and December).

STEP 3: In cell B11, enter the formula: =TREND(B2:B10,A2:A10,A11:A13) and press Enter.

Excel will predict the sales for October, November, and December based on the trend observed in the previous months. This method assumes that the sales will continue to increase in the same linear fashion.
Using the GROWTH Function for Exponential Extrapolation
The GROWTH function in Excel is used to predict future values that follow an exponential growth trend. Unlike linear functions like TREND or FORECAST, which assume a constant rate of change, the GROWTH function assumes that the data increases by a consistent percentage, resulting in a curve rather than a straight line.
=GROWTH(known_y’s, [known_x’s], [new_x’s], [const])
It takes known y-values, known x-values, and optionally, new x-values where you want to predict corresponding y-values. It is commonly used in scenarios where data exhibits exponential growth, such as population growth, compound interest, or certain types of sales trends.
Step-by-Step Guide:
STEP 1: Enter the data for the first nine months as before.

STEP 2: In cell A11, enter ’10’ for the month of October.
STEP 3: In cell B11, enter the formula: =GROWTH(B2:B10,A2:A10,A11) and press Enter.
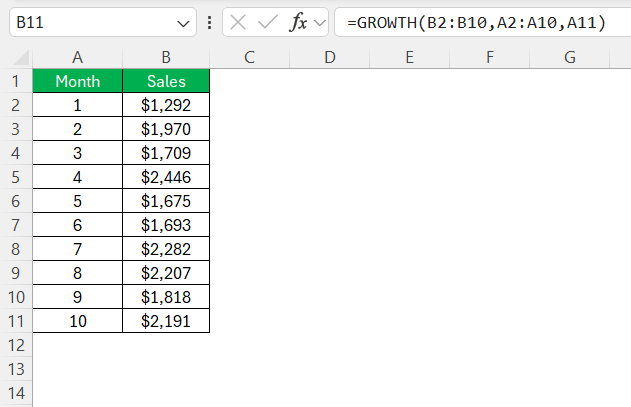
Excel will predict the sales for Octoberassuming exponential growth.
Practical Applications of Excel Data Forecasting
Improving Budgeting and Financial Planning with Forecasting
Improving budgeting and financial planning with forecasting in Excel can be quite transformative. By extrapolating historical financial data, we’re able to anticipate revenues, expenses, and cash flows with a good degree of accuracy.
This forward-looking analysis enables us to set realistic budgets and financial targets. It’s impressive how it aids in avoiding under or overestimating figures that could lead to financial strain or missed opportunities. The more accurate the forecast, the more prudent and strategic the financial planning becomes, laying a roadmap for sustained fiscal health.
Enhancing Market Research through Trend Analysis
Enhancing market research through trend analysis in Excel is akin to adding a high-powered lens to our analytical toolkit. We can extrapolate survey data, historical sales numbers, or any market-related data to predict future consumer behavior, demand patterns, or emerging market trends.
Trend analysis allows us to spot changes in consumer preferences or shifts in the competitive landscape before they’re blatantly obvious, giving us a strategic edge. By implementing this, we can inform product development, adjust marketing strategies, and make more informed business decisions that are aligned with where the market is heading.
Troubleshooting and Perfecting Your Forecast Models
Common Pitfalls and How to Avoid Them
Common pitfalls in Excel data forecasting often include over-reliance on too little data, not accounting for seasonal variations, or ignoring potential outliers. To sidestep these issues, we ensure we’re using a sufficiently large and representative dataset. We must also incorporate seasonal adjustments if our data is affected by periodic changes.
Evaluating the data for any anomalies that could distort the forecast and addressing them is key—sometimes by exclusion, other times by using specialized functions that can handle irregularities. Maintaining a critical eye on the forecast outputs and reality-checking them against domain knowledge and expected patterns is always a prudent approach.
Fine-Tuning Your Forecasts for Increased Accuracy
Fine-tuning forecasts in Excel for increased accuracy involves a mix of art and science. It starts with selecting the right forecasting technique that mirrors the data complexity. Tweaking parameters, like the confidence interval or the seasonality, can sharpen the forecast to reflect the underlying data pattern more precisely. Scrutinizing the residuals—the differences between actual and forecasted values—helps to understand and improve the forecasting model’s efficacy.
It’s essential to iterate and refine the model, sometimes using different sets of historical data to find the most robust method for predictions. Regularly updating the forecast with new data ensures that the predictions remain relevant and accurate.
FAQ
How do you extrapolate in Excel?
To extrapolate in Excel, I use functions like FORECAST, FORECAST.LINEAR, or TREND. Start by placing your known data in two adjacent columns, select the cell where you want the prediction, and enter the appropriate formula, referencing your data range for known Y and X values, followed by the new X value for which you want a forecast. Excel then calculates and displays the extrapolated value.
What Are the Key Differences Between FORECAST and TREND Functions in Excel?
The key differences between FORECAST and TREND functions lie in their input and output. The FORECAST function predicts one future y-value for a specific x-value using linear regression, whereas the TREND function can forecast multiple y-values for an array of new x-values, not limited to linear forecasting. While TREND suits scenarios with numerous predictions to make, FORECAST is designed for one-off future value estimation.
How Can I Ensure My Excel Forecast is Reliable?
To ensure an Excel forecast is reliable, validate your data for accuracy and completeness, use sufficient historical data to account for variability and trends, and select the appropriate forecasting model that fits the data’s characteristics. Additionally, conduct error analysis by comparing forecasted values against actual outcomes, adjust your model parameters accordingly, and frequently update the model with new data to maintain its relevance and precision.
Can Excel Handle Nonlinear Data Forecasting and, if so, How?
Absolutely, Excel can handle nonlinear data forecasting through several means. One method is by applying nonlinear trendlines—such as logarithmic, polynomial, and power—to chart data. Another is using the FORECAST.ETS function, which is specifically designed for series with seasonal trends and can cater to some nonlinear patterns. Additionally, the Solver add-in can optimize parameters in custom forecasting models, adapting them to nonlinear data.
What Steps Should I Take to Extrapolate Future Projections in Excel?
To extrapolate future projections in Excel, first assemble and clean your historical data. Next, ensure it’s in a supportive structure with time periods and variables correctly aligned. Choose an appropriate Excel function like TREND for linear data or FORECAST.ETS for seasonal data. Input your data ranges into the function, and define the point in the future you want to predict. Evaluate your results and refine your model as necessary to increase accuracy.

John Michaloudis is a former accountant and finance analyst at General Electric, a Microsoft MVP since 2020, an Amazon #1 bestselling author of 4 Microsoft Excel books and teacher of Microsoft Excel & Office over at his flagship MyExcelOnline Academy Online Course.


