Peek through the statistical keyhole to discover the power of the P-value. It’s the probability that study results are due to chance if the null hypothesis holds true—essential for determining statistical significance. In this article, we will learn 2 quick methods on how to calculate p value in Microsoft Excel.
Key Takeaways:
- P-Value: The Statistical Key – It unveils the likelihood of chance influencing study outcomes if the null hypothesis were accurate.
- Data Preparation is Crucial – Before diving into P-value calculations, ensure your data is pristine, organized, and free from errors.
- Simple Methods for P-Value Calculation – Excel offers user-friendly functions like T.TEST and Data Analysis ToolPak for swift P-value determination.
- Interpreting P-Values – A P-value below 0.05 suggests significant findings, while above indicates results may be due to chance.
Table of Contents
Unlocking the Mystery of the P-Value in Excel
What is a P-value?
Imagine you’re peering through a keyhole at the secret workings of statistical analysis. Right there, in the center of it all, is the P-value—an intriguing figure that holds the power to unlock the truth behind your data. In statistics, the P-value represents the probability that the results of your study could occur by chance if the null hypothesis, which is usually a statement of ‘no effect’ or ‘no difference’, were true.
It’s essentially the key that statisticians use to determine whether or not they’ve stumbled upon something that could be statistically significant.
The Role of P-Value in Hypothesis Testing
When you’re delving into hypothesis testing, the P-value acts like a trusty sidekick, helping you to navigate the tricky terrain of statistical significance. Think of it as a guide that tells you whether the observational differences or relationships uncovered in your data are likely to hold true for the wider population, or if they might just be the result of random chance.
A smaller P-value, one that dips below the agreed-upon threshold (often 0.05), whispers a hint that your findings may challenge the status quo, suggesting that the null hypothesis might not hold up. On the flip side, a larger P-value, one that looms above this benchmark, suggests that the null hypothesis cannot be dismissed—the results could simply be a fluke of chance.
Setting the Stage for P-Value Calculation
Preparing Your Data for Analysis
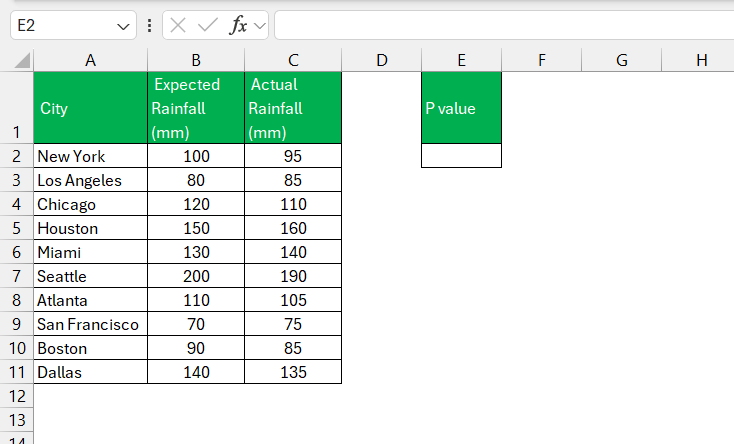
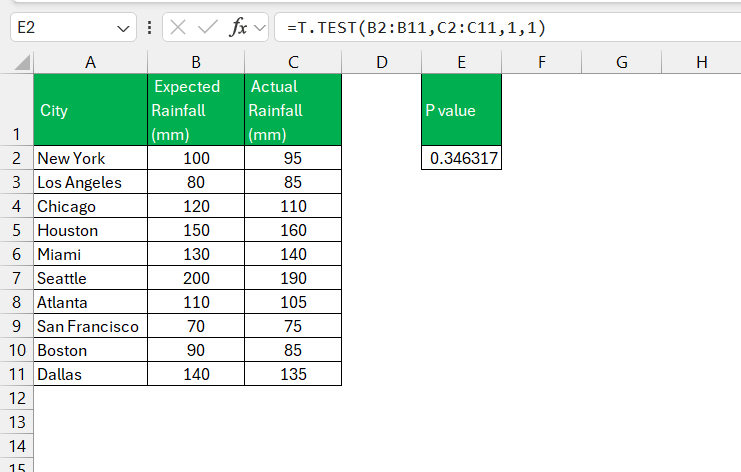
Before you get to unravel the secrets of the P-value, it’s crucial that you set the stage right by preparing your data. This means you should start off by arranging your experimental results into two clean columns, each representing different conditions or groups for comparison. Make sure that your data is neatly formatted without any stray values that could throw off your calculations. Remove duplicates, correct any entry errors, and ensure that all data points are consistent in their units of measurement.
This meticulous preparation clears the path for a smoother analysis and more reliable insights, setting a rock-solid foundation for your P-value calculations.
The Roadmap to Calculating P-Value
Method 1: Using the Insert Function Button
If you’re looking to calculate the P-value in Excel without getting too technical, then using the Insert Function button is like taking the scenic route on a data analysis road trip. Here’s what you need to do:
STEP 1: Park your cursor in the cell where you want the P-value to appear.
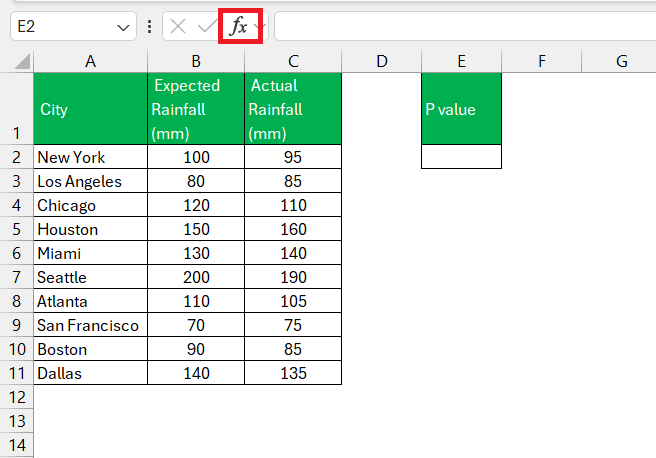
STEP 2: Click the “fx” button next to the formula bar, bringing up the Insert Function dialog box.
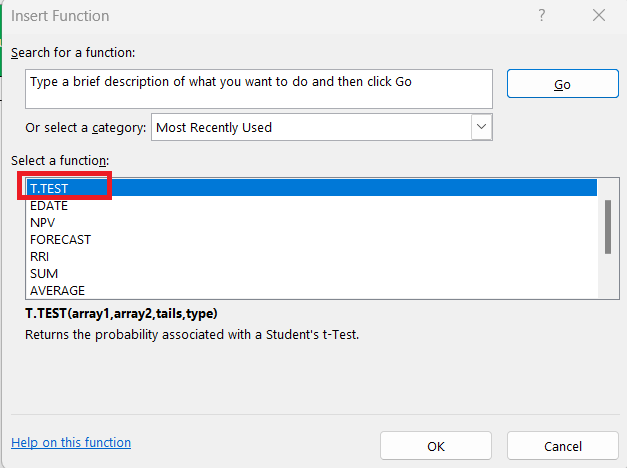
STEP 3: Now, type “T.TEST” into the search bar. When it pops up in the list, select it to open the door to calculate the P-value.
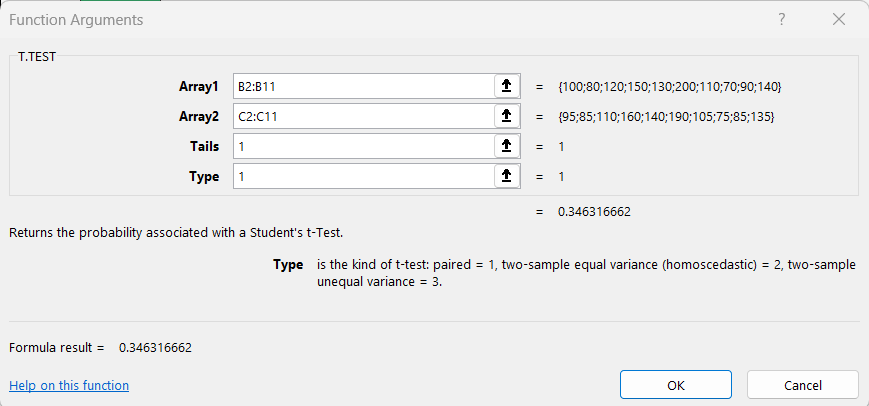
STEP 4: Next, you’ll be greeted by the Function Arguments dialog box. This is where you’ll input your data ranges for both groups you’re comparing into “Array1” and “Array2,” select whether you’re conducting a one-tailed or two-tailed test, and choose the type of t-test you’re running.
STEP 5: After hitting “OK,” Excel does the legwork and delivers the P-value right where you need it.
By using this friendly function, Excel handles the complex calculations in the background while you comfortably navigate through the intuitive interface.
Method 2: Delving into Analysis ToolPAk
To calculate the P-value using this method, follow the steps below:
STEP 1: Before we start, go to the Data Tab in Excel Ribbon and look for Data Analysis. If not found, follow the steps below to install it. Otherwise, you can directly go to STEP 5.
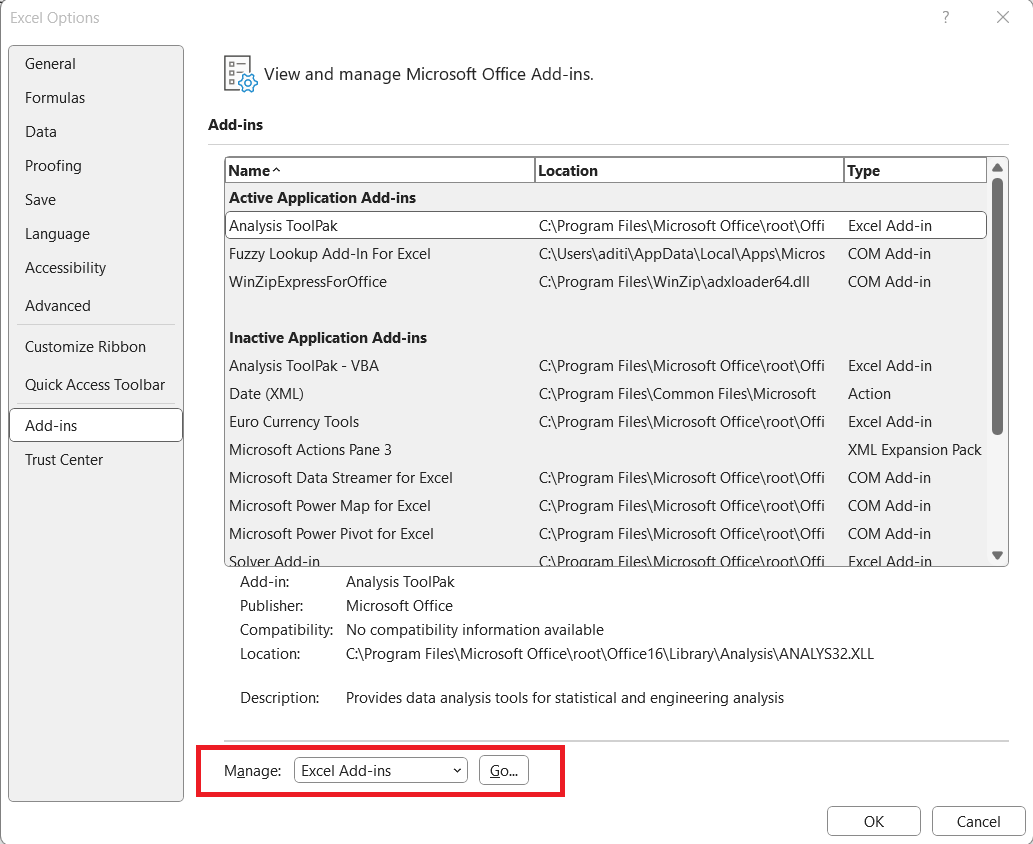
STEP 2: Go to File > Options.
STEP 3: In the dialog box, go to Add-ins in the left pane. Select Excel Add-ins from the dropdown and click on Go.
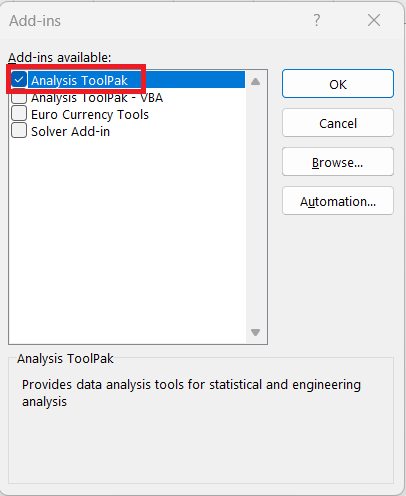
STEP 4: Select Analysis ToolPak and Click OK.
STEP 5: Go to Data Tab > Data Analysis.
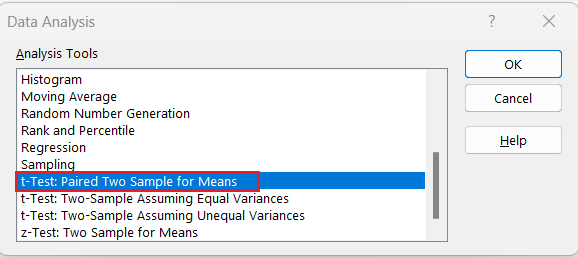
STEP 6: In the Data Analysis dialog box, select ‘t-Test: Paired Two Sample for Means’ and click ‘OK’.
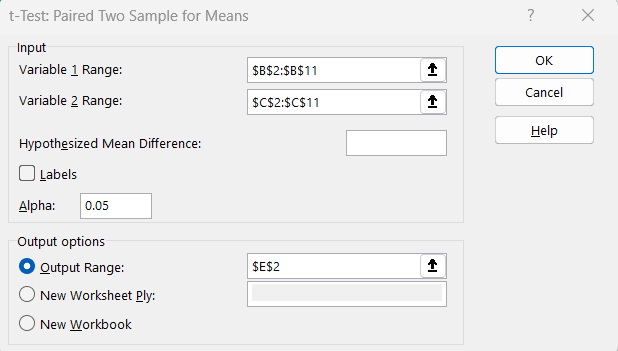
STEP 7: In the ‘t-Test: Paired Two Sample for Means’ dialogue box, select –
- Select the first data set as Variable Range 1.
- Select the second data set as Variable Range 2.
- Select Output Range.
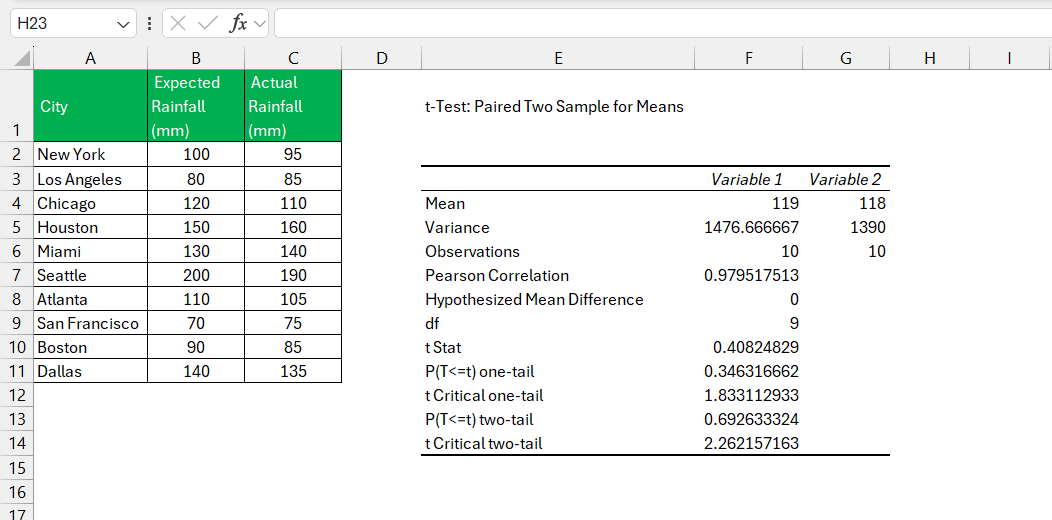
The p-value will be displayed in the t-test result.
Specific Paths for Different Tests
Deciphering One-Tailed P-Value Calculations
Engage your statistical gears, because when you’re calculating a one-tailed P-value, you’re taking a more directed approach. You’re essentially investigating if one dataset is significantly greater than or less than the other, not just different. Excel simplifies this process through its functions, allowing you to focus on whether your data leans significantly in one direction.
As you unpack your one-tailed results, remember that a P-value greater than your alpha level (commonly set at 0.05) signals that you shouldn’t reject the null hypothesis. Your findings fall within the realm of normal range, with no significant slant. However, if your P-value cruises below that threshold, it’s waving a flag that the alternative hypothesis deserves some spotlight—that there’s a significant tilt in your data.
Navigating Through Two-Tailed P-Value Computations
Navigating through two-tailed P-value computations is like setting sail in open waters—you need to be prepared for anything, as you’re testing for any significant difference without specifying a direction. In Excel, achieving this balanced approach is a matter of adjusting your sails—simply replace the tails argument with 2 when using the T.TEST function or the T Distribution functions.
In this wider sea of possibilities, a small P-value, again compared against the alpha level of 0.05 or your chosen criterion, hints at the presence of a significant difference. But unlike a one-tailed test, direction doesn’t factor in. The key is the magnitude of the difference—whether one dataset is either much greater or much less—it’s the difference itself that’s significant here.
So batten down the hatches and make sure your data is shipshape. When done correctly, two-tailed tests provide a robust analysis of your datasets, ensuring you capture any significant differences, wherever they may lie.
Interpreting Your Results
What Does Your P-Value Mean?
Your P-value is like a secret message about your data waiting to be decoded. A small P-value, typically less than 0.05, is a whisper of a revelation—it hints strongly that your results might not be due to just luck or random chance, instead pointing to a real effect or difference. In contrast, a P-value that’s larger tells you to hold your horses—there’s not enough evidence to declare that what you’re observing is anything more than a statistical mirage.
Think of your P-value as a gauge on your dashboard, with 0.05 being a critical threshold. If the needle is to the left, switch on your “Eureka!” alert. To the right, and it’s time to keep the champagne on ice, as further investigation or new data might be necessary to draw firm conclusions.
Making Informed Decisions Based on P-Values
Making decisions based on P-values is akin to using a compass on a data-driven expedition. It doesn’t point you to an X-marks-the-spot treasure chest directly, but it helps you avoid wandering aimlessly or falling into the quicksand of faulty conclusions.
With a P-value in hand, you can make decisions with greater confidence. If the P-value sails below the 0.05 threshold, it’s a strong wind in your sails towards rejecting the null hypothesis and considering your alternative hypothesis credible. On the flip side, if the P-value is above 0.05, it’s wise to consider that your hypothesis might need revisiting, or that more data could be needed to clarify the waters.
However, it’s essential to weigh your P-value against the context of your study, including the effect size and confidence intervals. Sailing toward the truth involves considering all instruments at your disposal—not just the P-value compass.
FAQs on Calculating P-Value in Excel
What is p-value in Excel?
The p-value in Excel is a probability score that tells you the strength of your evidence against the null hypothesis. It’s a way to measure if the data at hand could very well be a fluke or if there’s a statistically significant difference or association. In simpler terms, the p-value helps you understand whether your findings are due to actual effects or mere random chance.
How do you find the p-value in Excel?
To find the p-value in Excel, you’d typically use built-in functions like T.TEST for t-tests or the Data Analysis tool after installing the Analysis ToolPak. These Excel features help you calculate the p-value by inputting your data range, selecting tail type, and choosing the test type, guiding you swiftly towards the statistical significances in your data.
Is it necessary to have a strong statistics background to calculate p-values in Excel?
Not at all! While a solid grip on statistics can be beneficial, Excel’s user-friendly interface and functions greatly simplify the process of calculating p-values. You can perform these calculations effectively even with a basic understanding of statistical principles, thanks to Excel’s guided tools and wide array of resources available for support.
How can one-tailed and two-tailed tests affect the p-value in Excel?
In Excel, a one-tailed test evaluates if a dataset is significantly greater or less than another, influencing the p-value by focusing on a single direction of interest. Meanwhile, a two-tailed test checks for any significant difference regardless of direction, effectively doubling the critical area and can result in a larger p-value. Choosing between the two hinges on your hypothesis specifics, directly impacting the p-value and your conclusions.
Can Excel handle all types of hypothesis tests for p-value calculations?
Excel boasts a robust suite of statistical functions, able to tackle a wide range of hypothesis tests for p-value calculations. However, it may not be the best fit for extremely specialized or complex analyses, where dedicated statistical software would offer more nuanced control and options. For most standard tests, though, Excel has you covered.
John Michaloudis is a former accountant and finance analyst at General Electric, a Microsoft MVP since 2020, an Amazon #1 bestselling author of 4 Microsoft Excel books and teacher of Microsoft Excel & Office over at his flagship MyExcelOnline Academy Online Course.

