Creating and printing graph paper in Excel is surprisingly straightforward. As someone who frequently uses Excel for a variety of tasks, I’ve discovered that it’s a great tool for making custom graph paper. Whether you’re designing it for drawing, plotting data, or teaching purposes, Excel allows you to create and print graph paper tailored to your needs. Here’s a step-by-step guide to show you how I do it.
Key Takeaways:
- Excel’s Versatility: Excel is a surprisingly effective tool for creating custom graph paper with precision.
- Customizable Options: You can adjust cell size, grid color, and even paper type to suit your needs.
- Print Preparation: Proper setup, including margins, gridlines, and print quality, ensures a professional printout.
- Template Creation: Save your custom graph paper as a template for future use to save time.
- Preview Before Printing: Always use the ‘Print Preview’ feature to ensure the layout and settings are accurate.
Table of Contents
Introduction to Graph Paper Creation in Excel
The Benefits of Custom Graph Paper
Custom graph paper has changed the game for those of us who want the precision of grids tailored to specific needs. It’s remarkably easy to create just the type of graph paper you need without having to search for the right pad or wait for delivery.
Plus, the customization capabilities are almost endless: want a lilac-colored dot grid for your bullet journal or a heavyweight cardstock for your architectural design? You’re just a few clicks away!
Excel as a Tool for Graph Paper Generation
When we think of Excel, spreadsheets and formulas are what typically come to mind. But its versatility extends beyond mere number-crunching. Excel is a hidden gem for generating custom graph paper, offering a canvas that accommodates a range of square and non-square grids.
Its ability to adjust to fine measurements and support for high precision makes it an excellent tool for educators, students, engineers, and artists to visualize, draft, and plot their work with remarkable accuracy.
Graph Paper in Excel
Step 1: Change to “Page Layout” View
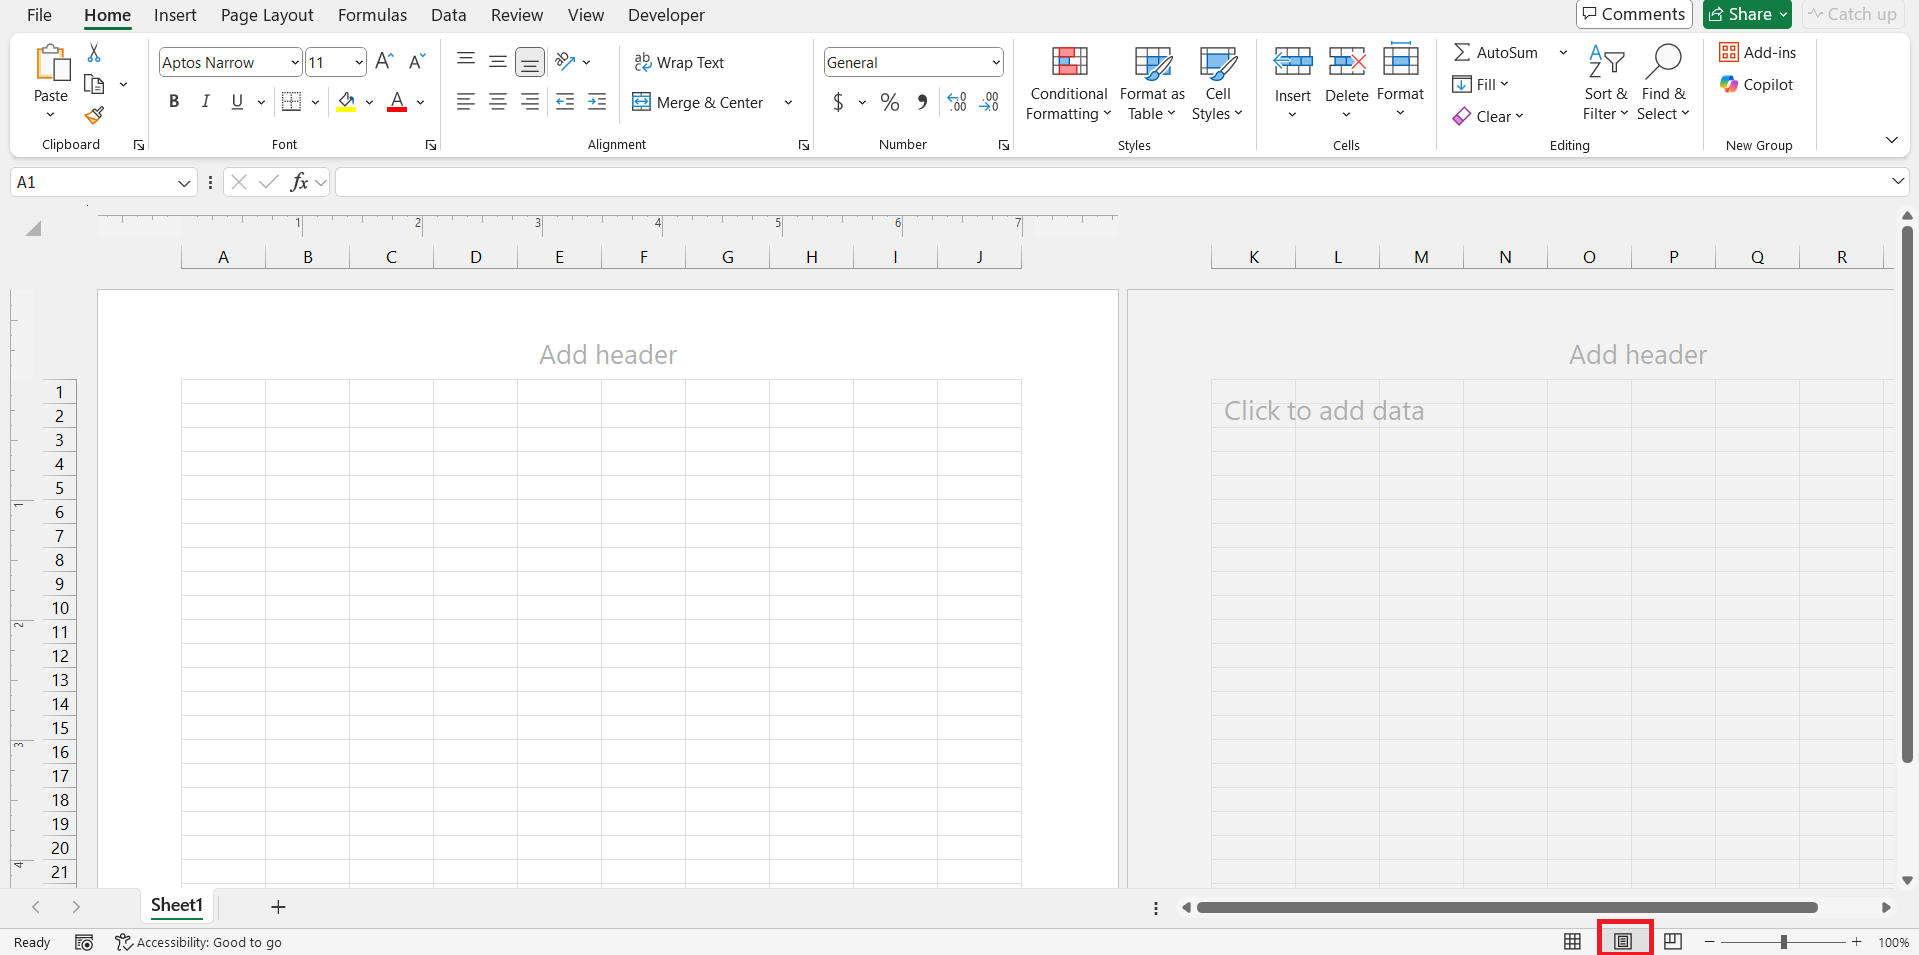
Diving into Excel’s capabilities requires familiarization with its varied views, each optimized for specific tasks. When creating graph paper, we first need to see what the finished product will look like on a physical page.
Thus, the ‘Page Layout’ view becomes the go-to choice. By selecting it in the bottom right corner or from the ‘Workbook Views’ section in the ‘View’ tab, the worksheet transforms.
Cells and elements are now displayed as they will appear on the printed page, making customization for printing intuitive and effective.
Step 2: Select all cells
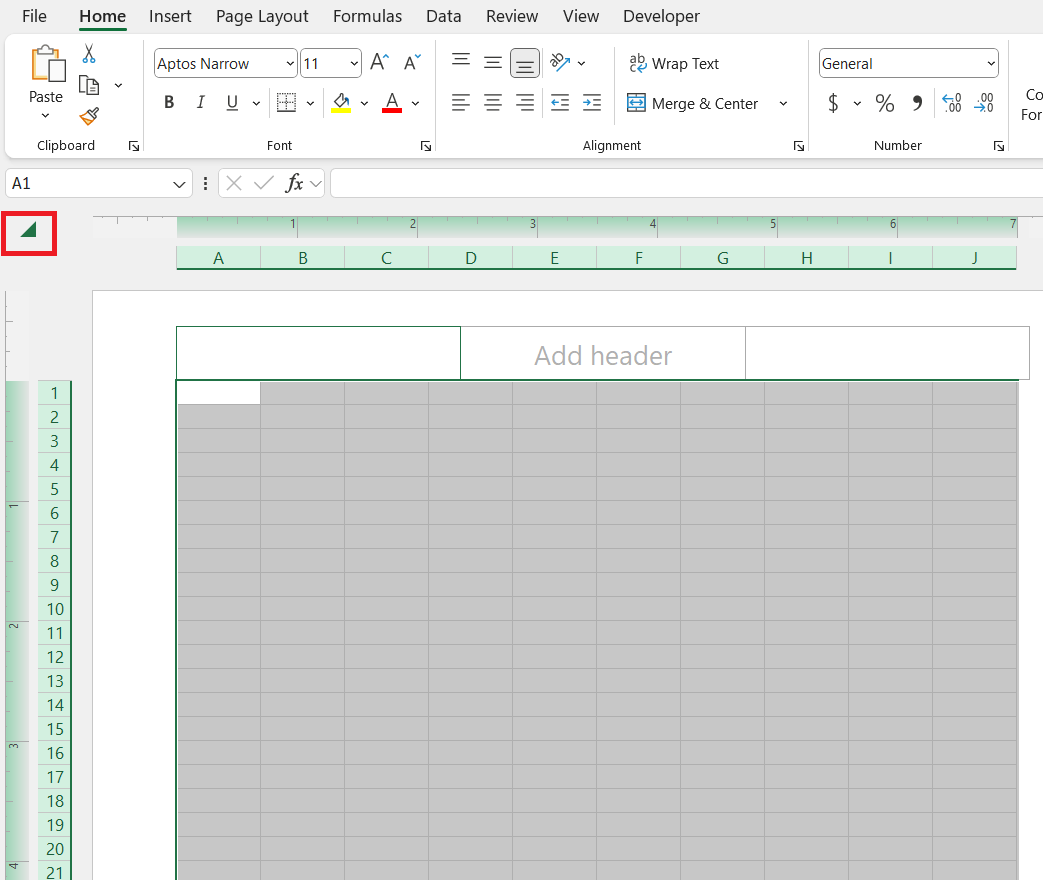
To uniformly transform the worksheet into graph paper, we must start by selecting all the cells. This is where the magic begins. It’s a straightforward task: click the triangle located at the upper-left corner of the sheet, near the row numbers and column letters.
This handy button is a powerful shaper of your worksheet landscape. With all cells now highlighted, each modification we apply next will be uniformly distributed across the entire sheet, paving the way for a precise and consistent graph paper layout.
Step 3. Format the Column Width and Row Height
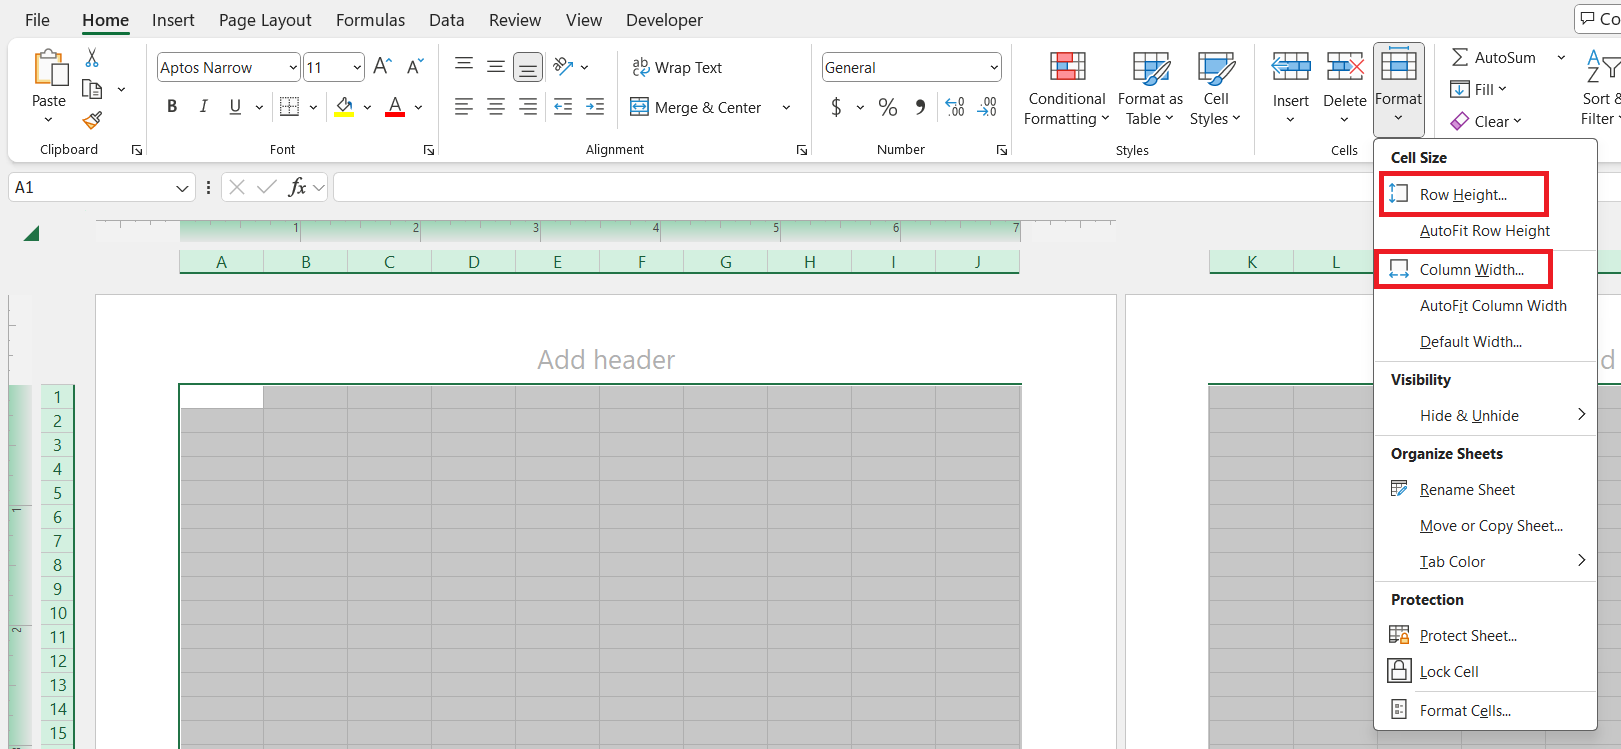
Now, let’s shape each cell into a perfect square, quintessential for graph paper. In the ‘Home’ tab under ‘Format’, both ‘Row Height’ and ‘Column Width’ options await our input.
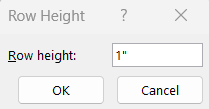
Uniformity is key; entering a value of 1 for row height and 1 for column width does the trick nicely.
Just like that, each cell transforms into a tiny, perfectly proportioned square, instilling order and uniformity across your digital page, ready to handle your most detailed plans and sketches.
Step 4. Set Page Options and Margins
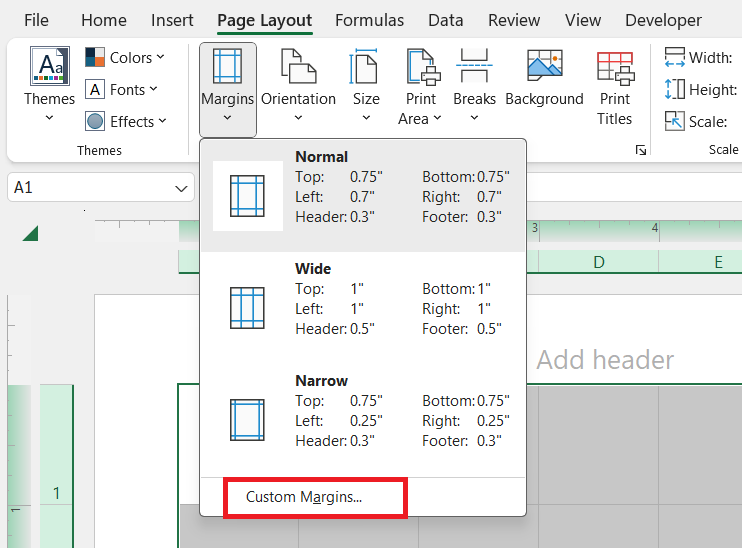
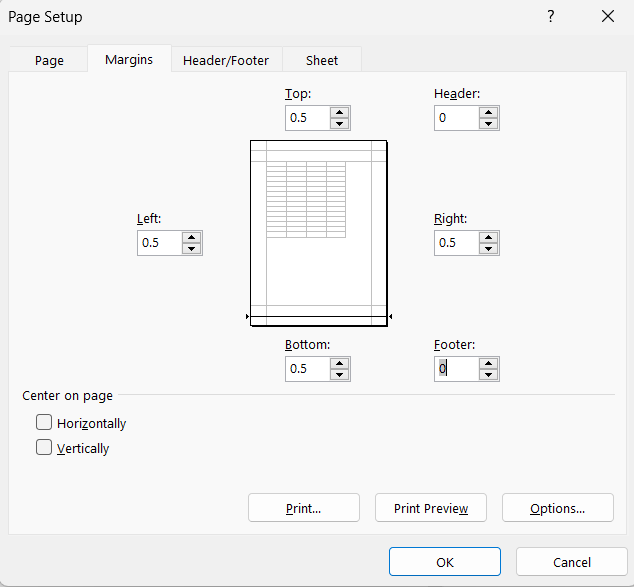
Ensuring that the graph paper prints as accurately as we see it on screen requires setting up page options and margins diligently. In Excel, navigate through the ‘Page Layout’ tab and click ‘Margins’, selecting ‘Custom Margins’.
Here, reducing the margins to 0.5 inches and zeroing out Header and Footer spaces creates a more expansive area, maximizing the usage of your page.
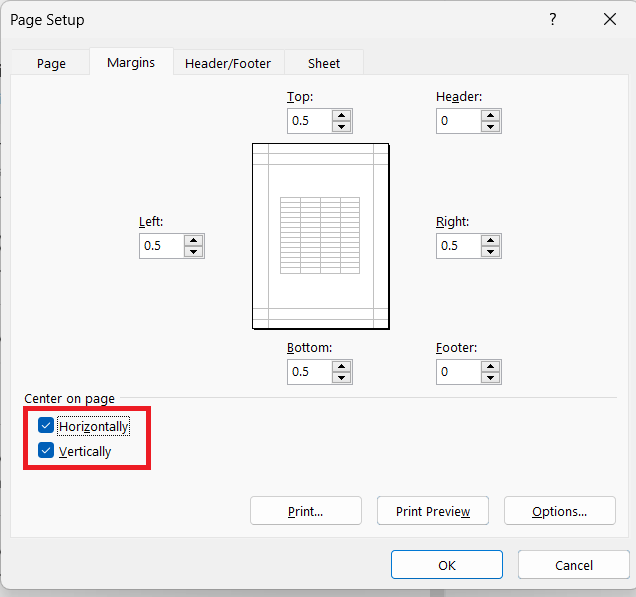
Checking both ‘Horizontally’ and ‘Vertically’ under ‘Center on page’ ensures that your graph lays perfectly centered when printed.
Do not forget to check ‘Gridlines’ under ‘Print’ in the ‘Sheet’ tab, a crucial step as it allows the gridlines of the cells to be visible upon printing, transforming your sheet into ready-to-use graph paper.
Adding Final Touches for a Professional Look
Use Limited Data for Grid Precision
When we aim for precision, it’s pivotal to consider the amount of data plotted within each cell grid. Overloading cells with data can distort the grid, especially if the content exceeds the cell’s size, leading to an untidy look.
To maintain a professional and precise appearance, keep data input to a minimum. Ideally, limit the text to simple indicators, symbols, or numbers that comfortably fit within the confinement of the cells. This minimalistic approach keeps the grid’s integrity intact, making your graph paper clean and precise.
Adjusting for Print Quality
The crispness of the lines on your graph paper is directly linked to the print quality. Navigate to ‘Print Settings’ and select the highest quality your printer can deliver – typically labeled ‘Best’ or ‘High’.
This ensures that each line is distinct and the grid is clear when printed.
Remember, the ink used can vary based on printer type; for inkjets, use smudge-resistant ink, while for laser printers, ensure the toner is well-stocked for the sharpest results. Adjusting these settings helps translate the detailed work you’ve done on-screen to a high-quality graph paper printout.
Printing Your Custom Graph Paper
Previewing Your Graph Paper Layout
Before proceeding to print a stack of graph paper sheets, it’s wise to review everything thoroughly. Excel’s ‘Print Preview’ is invaluable for this final check. By pressing ‘Ctrl + P’, you can inspect the layout, ensuring that the grid aligns correctly on the page and the margins are as intended.
Look for uniformity across the grid and make sure the print settings retain the adjustments for quality. This preview acts as a guardian, ensuring your efforts in customization are well-reflected in the final product and saving paper and ink from potential misprints.
Return to ‘Normal’ Page View (Optional)
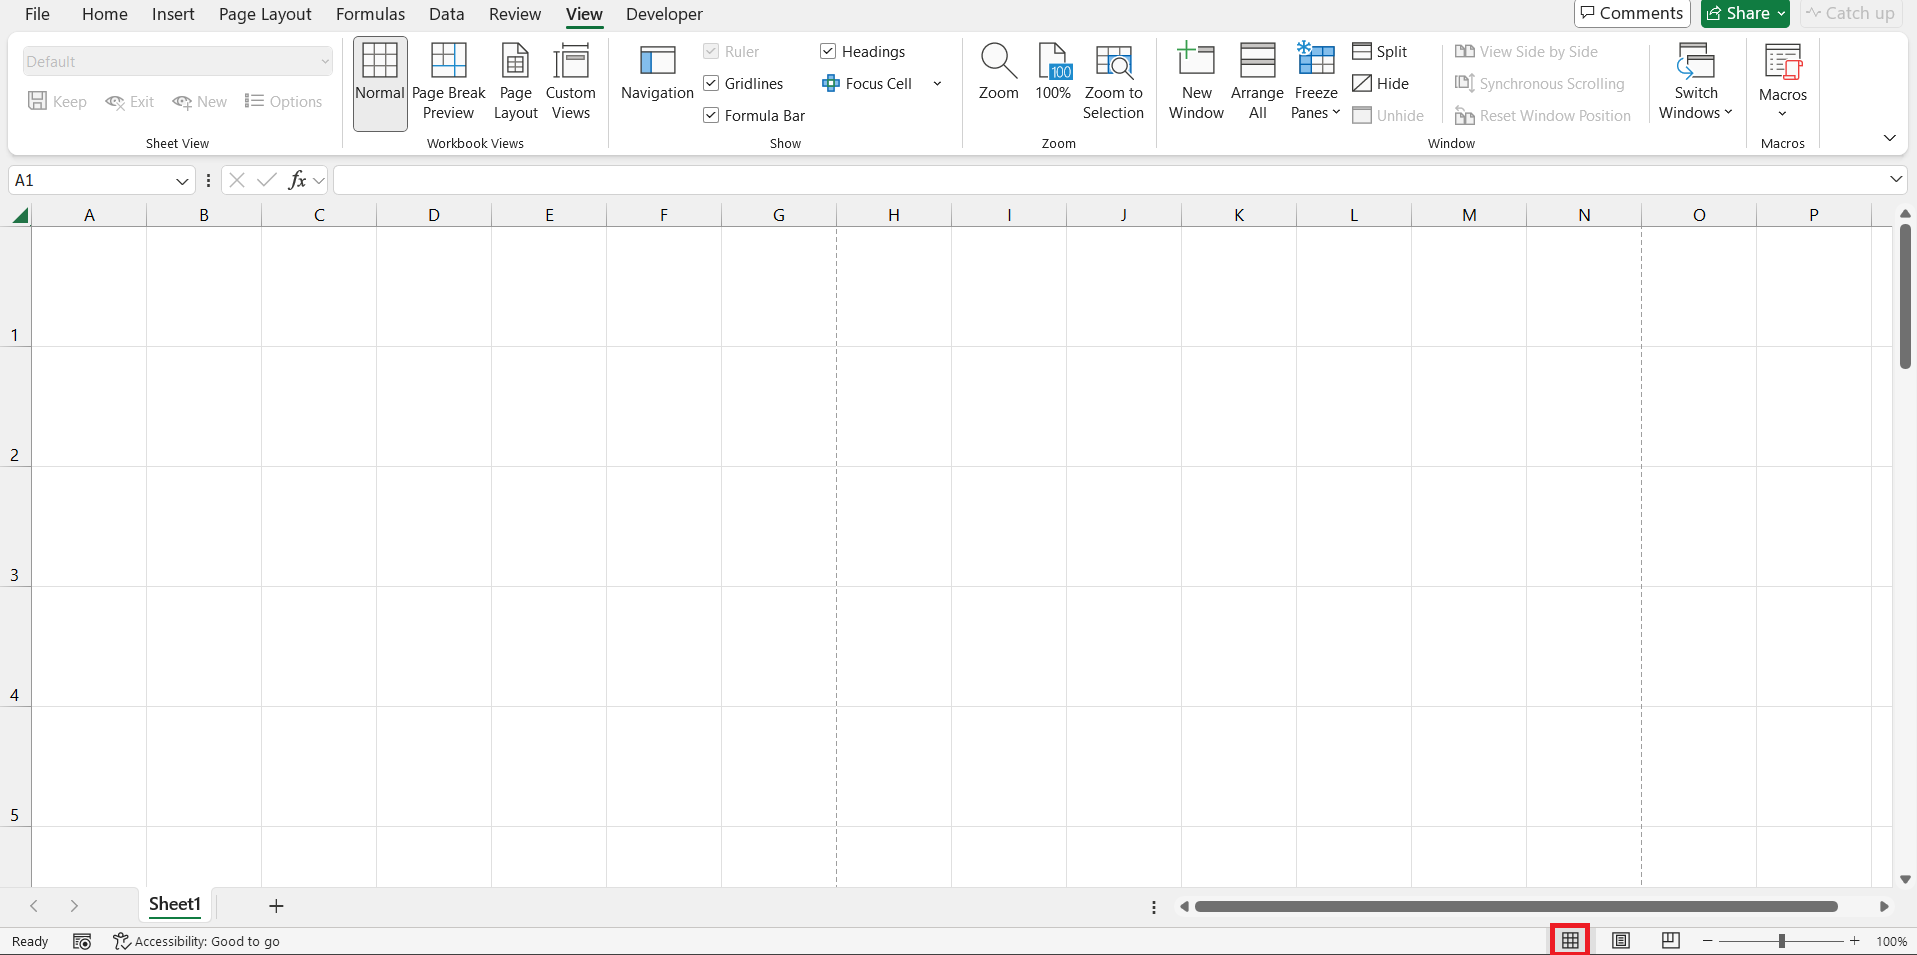
If you’re content with the preview and your graph paper is ready for the printer, you might want to switch back to Excel’s ‘Normal’ view to continue adding data or adjusting the template for future use.
To do this, simply select the grid button in the bottom right-hand toolbar, returning the display to the continuous grid that is best suited for editing and entering data.
This step, while optional, reverts your workspace back to the conventional Excel environment, perfect for further manipulation or analysis.
FAQ Section
Can I print graph paper in Excel?
Yes, indeed! With some clever adjustments in Excel, you can create and print your custom graph paper. By setting uniform column widths and row heights, adjusting page layout options, and ensuring the gridlines are set to print, Excel becomes a powerful tool for generating graph paper tailored to your needs.
Can I save my Excel graph paper template for future use?
Absolutely, you can save the graph paper you’ve created as an Excel template for future use. Once you’re satisfied with your graph paper layout, go to ‘File’, choose ‘Save As’, and select ‘Excel Template’ from the drop-down menu. This saves your customized graph paper settings, enabling you to reopen and print it anew anytime you need it, without having to recreate it from scratch.
How can I ensure that my printed graph paper matches the Excel preview?
To ensure your printed graph paper matches the Excel preview, double-check your ‘Page Layout’ settings, set your printer to the highest quality print settings, and use the ‘Print Preview‘ feature (Ctrl + P) carefully before printing. Consistent match often involves tweaking margins, ensuring that ‘Print Gridlines’ is checked, and selecting the correct paper size and orientation.
John Michaloudis is a former accountant and finance analyst at General Electric, a Microsoft MVP since 2020, an Amazon #1 bestselling author of 4 Microsoft Excel books and teacher of Microsoft Excel & Office over at his flagship MyExcelOnline Academy Online Course.

