If you’ve ever faced a situation where your Excel data isn’t structured in neat columns and rows — you know, where every few rows form a “set” of information instead of a single record — then you’ve met the dreaded flat data. And let’s be honest: cleaning flat data manually is a patience test no one asked for. But here’s the good news — Power Query (known as Get & Transform in Excel 2016 and later) can handle this in seconds. Using a clever trick with the Modulo function, you can transform messy, repetitive flat data into clean, structured tables with ease.
Let’s dive into how to process flat data using Modulo in Power Query — step-by-step — and see how this powerful combo can save you hours of grunt work.
Key Takeaways:
- Flat data is messy data stored in a single column or repeating rows, making analysis difficult.
- Power Query (Get & Transform) lets you clean, shape, and transform data quickly in Excel.
- Adding an Index Column and using Modulo helps identify repeating patterns in flat data.
- Filtering by Modulo values isolates specific parts of a record, like names, regions, or sales.
- This method saves time, automates repetitive tasks, and can be applied to many real-world datasets.

Table of Contents
Understanding Power Query and Flat Data in Excel
Power Query Made Simple
Power Query, introduced in Excel 2010 as an add-in and later built directly into Excel 2016 and beyond as Get & Transform, is a powerful data transformation engine.
It allows you to:
- Import data from multiple sources (Excel, CSV, web, SQL, etc.),
- Clean, shape, and transform that data,
- And then load it back into Excel for reporting or analysis.
Think of it as Excel’s “data kitchen” — where you prepare your raw ingredients (data) before serving the final dish (report). Every action you take in Power Query — adding columns, filtering data, changing data types — is recorded as a step. These steps can be refreshed anytime, automating repetitive cleanup tasks beautifully.
What is Flat Data?
Flat data is a type of dataset where all information is stored in a single column or row structure without proper organization into separate fields or records. In other words, instead of each row representing a complete record with distinct columns for each attribute, the data repeats in a pattern across rows or columns.
Example of Flat Data:

Here, each record (Region, Salesperson, Sales) spans three rows instead of being in separate columns. This makes analysis, pivoting, and reporting difficult without restructuring.
In contrast, structured data would look like this:

Key point: Flat data is “messy” because the repeating pattern isn’t organized into proper rows and columns. Power Query can help transform it into structured data efficiently. If you want, I can also explain why Modulo is perfect for processing flat data in Excel.
Process Flat Data using Modulo
Step by Step Guide
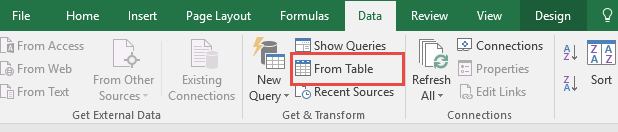
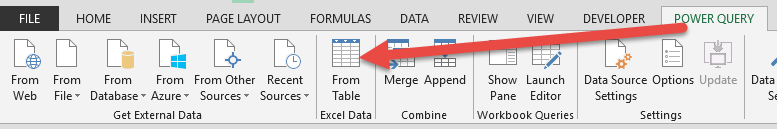
STEP 1: Select your data and go to Data > Get & Transform > From Table (Excel 2016) or Power Query > Excel Data > From Table (Excel 2013 & 2010)
Excel 2016:
Excel 2013 & 2010:
STEP 2: This will open up the Power Query Editor.
Notice that our flat sales data has a pattern. The pattern “Region, Salesperson Name, Sales” repeats every 3 rows!
Let as add an Index Column to number all of the rows. Go to Add Column > General > Index Column

STEP 3: This is where the magic happens!
Make sure the Index column is selected. Go to Add Column > Number Column > Standard > Modulo

Since our pattern repeats every 3 rows, let us type in 3. Click OK.

Now we have our modulo results.

STEP 4: Notice that the Salesperson name consistently matches the Modulo value 1? We can now extract the names quickly!
Click on the Filter icon of the Modulo column and make sure only 1 is ticked. This will hide the other unnecessary rows.

STEP 5: Click Close & Load from the Home tab, and this will open up a brand new worksheet in your Excel workbook with the updated records!

You now have the names thanks to Modulo in Power Query!
Why Modulo Works So Well Here
Modulo helps identify patterns in repetition. In flat data, that’s exactly what we need.
Let’s summarize:
- Flat data usually has a fixed repetition cycle (e.g., every 3 rows, 4 rows, etc.).
- An Index Column gives every row a number.
- Modulo helps mark which part of the pattern each row belongs to.
- Filtering by Modulo value isolates specific elements (like names, regions, or amounts).
It’s mathematical precision meets data transformation genius.
Real-World Use Cases for Modulo in Power Query
Modulo isn’t just for flat data! Here are a few smart ways to use it:
- Alternate Row Tagging: Highlight even or odd rows by using Modulo 2 — useful for formatting or conditional logic.
- Sampling Data: Keep every nth row in a dataset (e.g., every 10th record for sampling or testing).
- Grouping in Repetitive Logs: For system or IoT data that logs in repeating sequences, Modulo can help split those sequences into distinct records.
- Rebuilding Headerless CSV Imports: Some CSVs dump everything in one column. Using Modulo, you can re-segment the data back into meaningful columns.
Power Query’s flexibility with Modulo makes it one of those “once-you-see-it-you-can’t-unsee-it” tricks.
FAQs
1. What is flat data in Excel?
Flat data is a dataset where information is not organized into separate fields or records. Instead, each record spans multiple rows or columns in a repeating pattern. This makes it hard to analyze, pivot, or chart without restructuring. Power Query can help turn flat data into a clean, structured table quickly.
2. What is Power Query and why use it?
Power Query, built into Excel 2016+ as Get & Transform, is a tool for importing, cleaning, and transforming data. It records every step of your transformation, making it repeatable and refreshable. Using Power Query reduces manual work, especially for messy or flat datasets, and automates repetitive tasks.
3. How does the Modulo function help process flat data?
The Modulo function returns the remainder after division. When applied to an Index Column, it identifies repeating patterns in flat data. For example, if each record spans 3 rows, using Modulo 3 tags each row as part of Region, Name, or Sales, making it easy to filter and extract the desired data.
4. Can I extract multiple elements like Region, Name, and Sales at once?
Yes. You can create separate queries filtered by different Modulo values (e.g., 0 for Region, 1 for Name, 2 for Sales), then merge them using the Index Column as a key. This reconstructs the flat data into a structured table with all elements aligned properly.
5. Are there other uses for Modulo in Power Query?
Absolutely! Modulo can highlight alternate rows, sample every nth record, group repeating logs, or rebuild headerless CSV imports. Its versatility makes it ideal for spotting patterns, restructuring data, and automating complex transformations in Excel.

Bryan
Bryan Hong is an IT Software Developer for more than 10 years and has the following certifications: Microsoft Certified Professional Developer (MCPD): Web Developer, Microsoft Certified Technology Specialist (MCTS): Windows Applications, Microsoft Certified Systems Engineer (MCSE) and Microsoft Certified Systems Administrator (MCSA).
He is also an Amazon #1 bestselling author of 4 Microsoft Excel books and a teacher of Microsoft Excel & Office at the MyExecelOnline Academy Online Course.


