When analyzing data trends in Excel, the moving average (or rolling average) is one of my go-to tools. It smoothens fluctuations in data, making patterns easier to identify. Whether you’re analyzing sales trends, stock prices, or seasonal performance, Excel makes calculating moving averages straightforward. Let me guide you through the process step-by-step.
Key Takeaways:
- Simplify Data Analysis: Rolling averages smooth out fluctuations, making trends easier to spot in data.
- Versatile Applications: Use rolling averages for business, finance, quality control, and more.
- Dynamic Calculations: Excel formulas like AVERAGE and OFFSET enable flexible rolling average setups.
- Powerful Add-Ins: The Analysis ToolPak provides quick and advanced rolling average solutions.
- Real-World Value: Rolling averages uncover actionable insights, improving decision-making across fields.
Table of Contents
Understanding the Excel Rolling Average
What is a Rolling Average?
A rolling average calculates the average of a set number of data points, updating as you move through your dataset. For instance, if I use a 3-day rolling average, it averages the first three days, then shifts to the next three, and so on. This way, I get a smoothed representation of the data that reduces short-term fluctuations.
Common Uses for Rolling Averages in Data Analysis
Rolling averages are incredibly versatile tools in data analysis. Here’s how we can apply them in various business and research scenarios:
- Business Sales Trends: By deploying rolling averages, companies discern underlying sales trends, eliminating misleading spikes or drops due to seasonality or promotions.
- Stock Market Movements: Investors often use rolling averages to smooth out short-term volatility and identify longer-term market trends for securities.
- Quality Control: In manufacturing, rolling averages help in monitoring product weights, sizes, and other attributes to assure consistency over time.
- Economic Indicators: Economists use them to analyze unemployment rates, GDP growth, and other indicators to provide a clearer picture of economic health.
- Performance Tracking: Athletes and coaches apply rolling averages to workout results or game statistics to understand performance trends.
In each case, the rolling average serves the fundamental purpose of reducing noise and uncovering the true direction in which the numbers are moving. We provide valuable insights that are less apparent from raw data, allowing stakeholders to make more informed decisions.
Setting Up Your Spreadsheet for Success
Organizing Data for Rolling Average Calculations
Before diving into the calculations, it’s critical to organize our data methodically. I always ensure that the data is sorted chronologically or sequentially, depending on the parameters of the analysis. It is like stacking books on a shelf in the right order so that finding the one you need is a breeze.
Here’s how to set the stage for success:
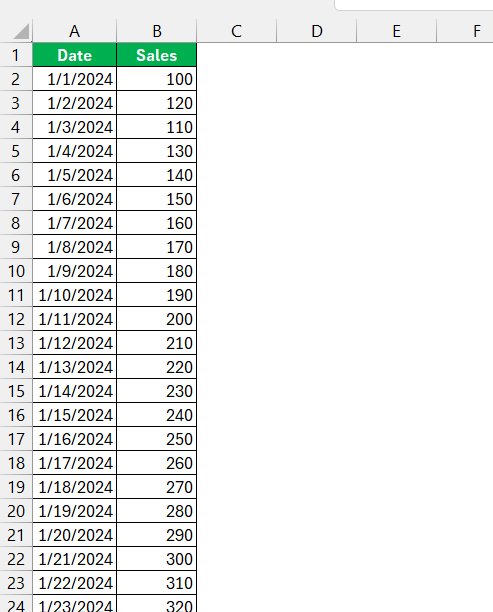
- Column Setup: Streamline the data into columns. For instance, time periods on one column and the corresponding data on the adjacent column.
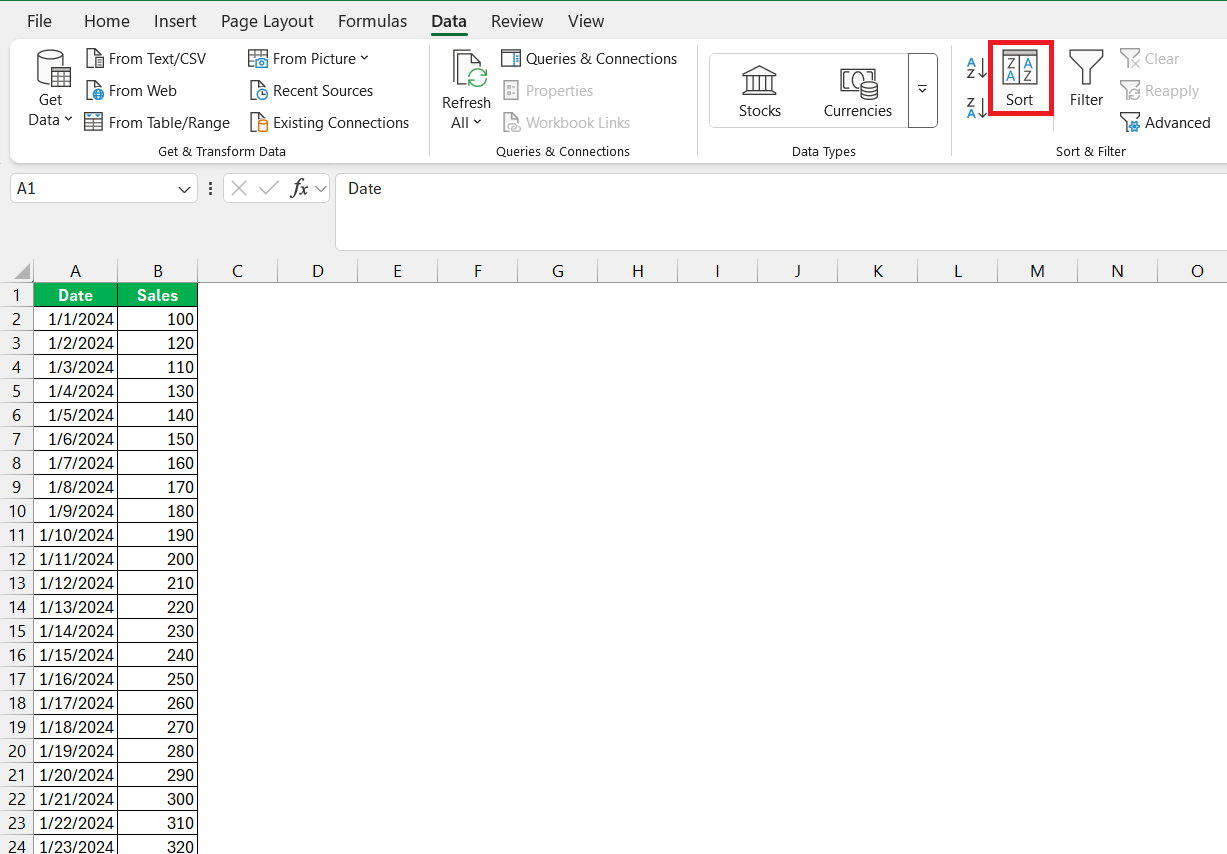
- Sort Your Data: Ensure your data points are in the correct order, whether it’s by dates, months, quarters, or any sequential order.
- Check for Consistency: Verify that there are no gaps or inconsistencies. Every data point should be accounted for in the period being analyzed.
A well-structured Excel sheet enables smooth sailing when it’s time to apply formulas. I always double-check for any anomalies that might skew the rolling average, such as empty cells, duplicates, or outliers.
How to Calculate a Simple Moving Average in Excel
Using the AVERAGE Function for Basic Rolling Averages
When it comes to crafting a basic rolling average, I turn to the trusty AVERAGE function in Excel. This function is elegantly simple: select the range of data points, and it returns the mean value. Here’s how I set it up for a rolling average:
STEP 1: Determine the number of data points to include in the average. For a 7-day average, I’d select seven cells.
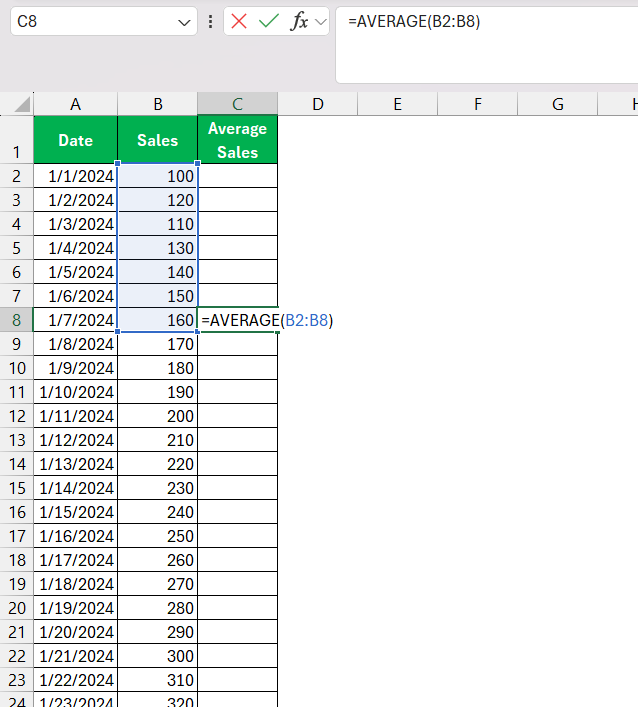
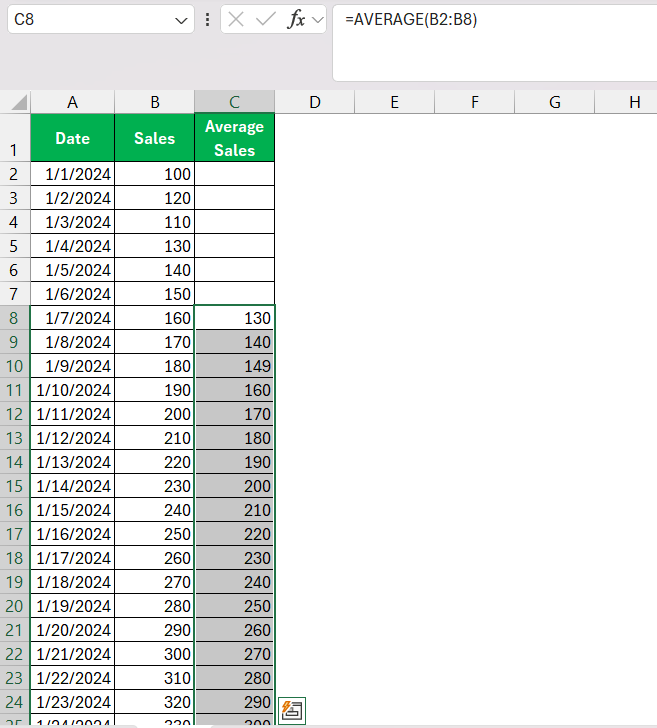
STEP 2: Click into the cell where I want my rolling average to appear, type =AVERAGE(, and then highlight the range or type it in manually.
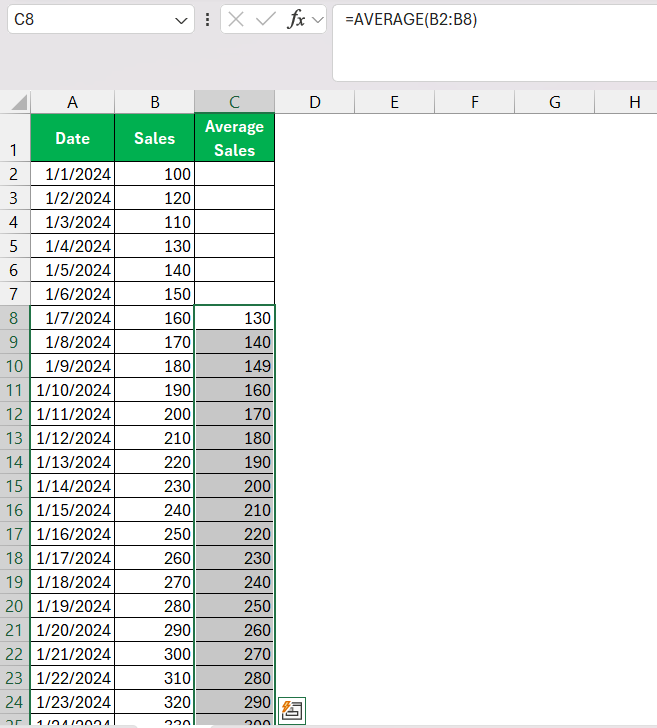
STEP 3: After entering the formula, I drag the fill handle down the column to apply the formula to subsequent cells. As the formula is copied, the referenced range shifts accordingly, thanks to relative cell references.
For example, to calculate a 7-day rolling average starting from the 8th data point on, the formula would look something like this: =AVERAGE(B2:B8) entered in cell C8. Afterward, copying this formula down the column will adjust it to calculate the average for the next 7-day period automatically.
Always remember, when working with a rolling average, the positioning of the formula is just as important as the formula itself. It’s the first domino in a chain that will set the pace for the rest of the data series.
Tips for Selecting the Right Data Range
Selecting the right data range for a rolling average calculation is akin to choosing ingredients for a dish—use fresh data for the best results. Here’s what I keep in mind:
- Size of the Interval: The range should align with the interval size, which depends on the periodicity of the data and the desired smoothness of the average.
- Start Point: Begin with the first period that fulfills your rolling average criteria. For instance, for a 7-day average, my range starts from the 7th data point onward.
- Consistent Intervals: Ensure the range contains an uninterrupted sequence of data for accurate computation.
A correctly chosen range paves the way to meaningful insights—it provides context and relevancy to the analysis being performed. The diligence in selecting the appropriate range differentiates a well-prepped dataset from one that may lead to skewed interpretations of trends.
Advanced Rolling Average Techniques
Variable Periods with OFFSET Function
When I need a more adaptable solution for rolling averages, I often rely on the OFFSET function in Excel. This function excels because it allows me to create a dynamic range, meaning I can set up a formula where the number of periods included in the average is variable.
This flexibility is especially useful when I’m dealing with data sets that require different average periods or when I want to allow users the ability to easily adjust the period length. Here’s how:
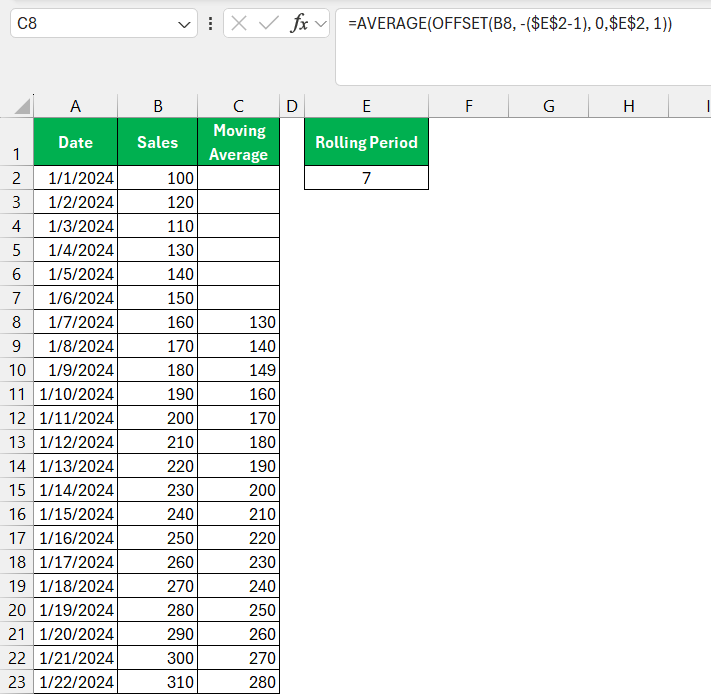
STEP 1: In a separate cell (e.g., E2), enter the rolling period (e.g., 7).
STEP 2: Then, I use this formula:
=AVERAGE(OFFSET(B8, -(E2-1), 0, E2, 1))
This formula adjusts the rolling average period based on the value in E2.
Rolling Averages Using the Analysis ToolPak
To expedite rolling average calculations, the Analysis ToolPak in Excel is my go-to solution when I need more advanced statistical functions without going through extensive formula setups. Here’s how I put it to work:
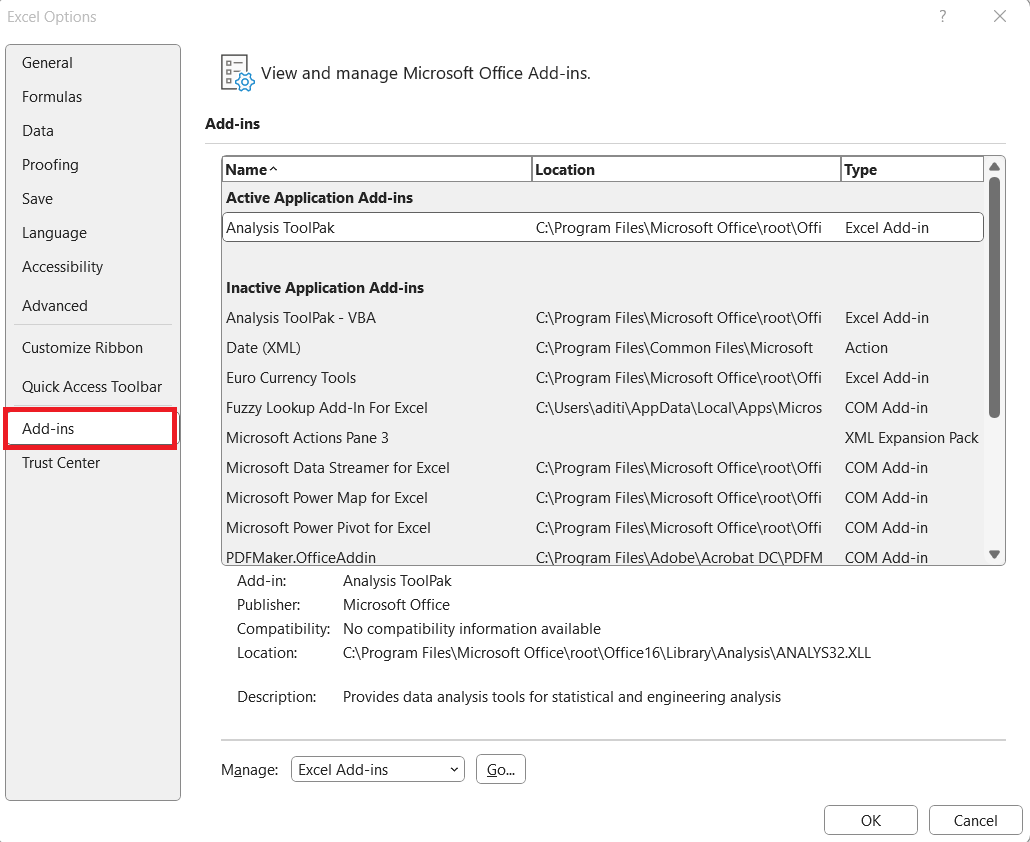
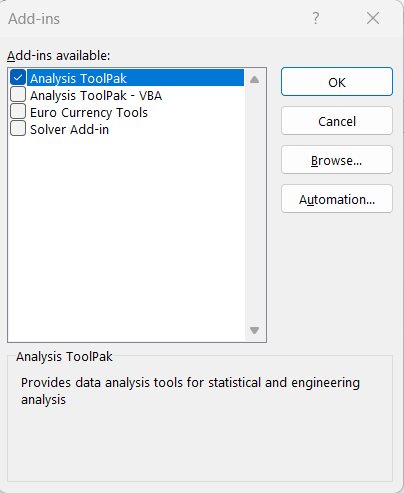
STEP 1: Go to File > Options > Add-ins.
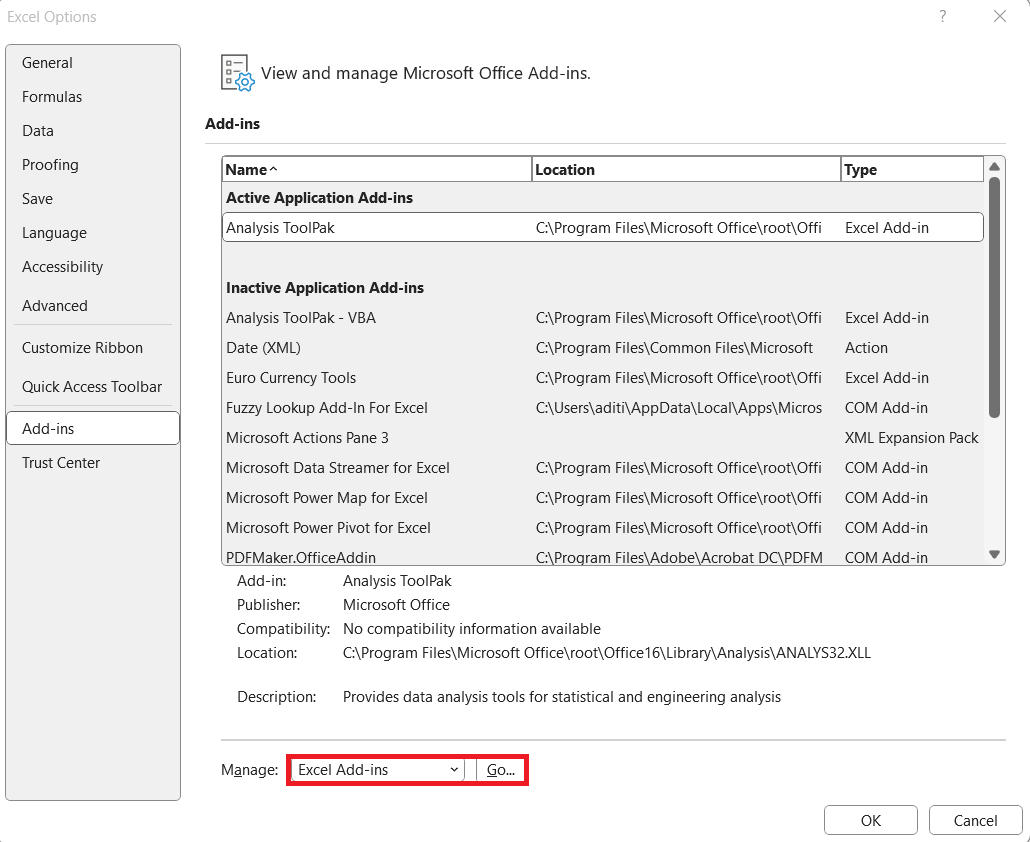
STEP 2: Click on Excel Add-ins in the Manage dropdown and select Go.
STEP 3: In the Add-ins window, select Analysis ToolPak and click OK.
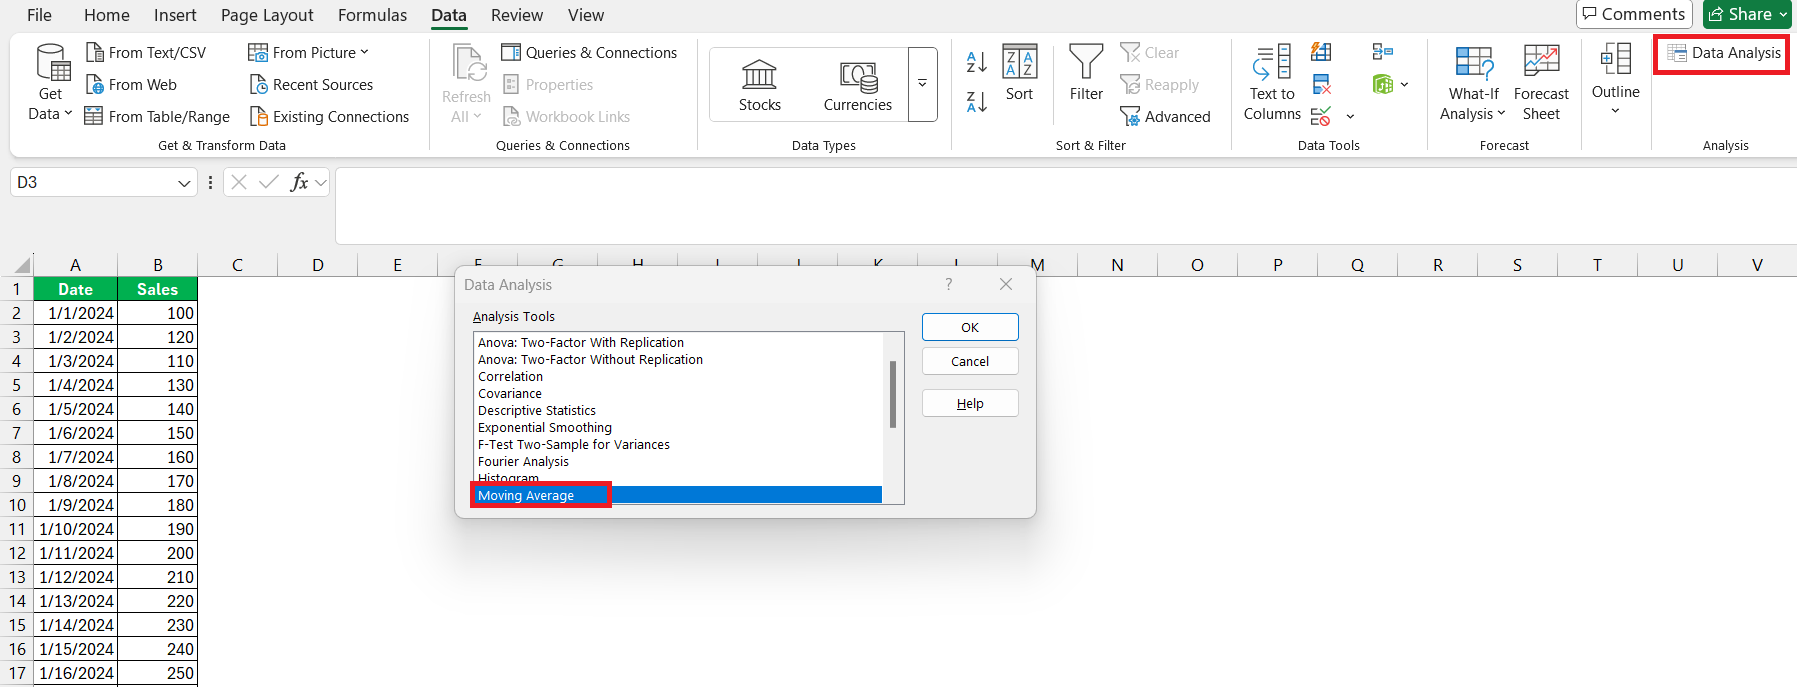
STEP 4: Once enabled, I navigate to Data > Data Analysis and choose Moving Average from the list.
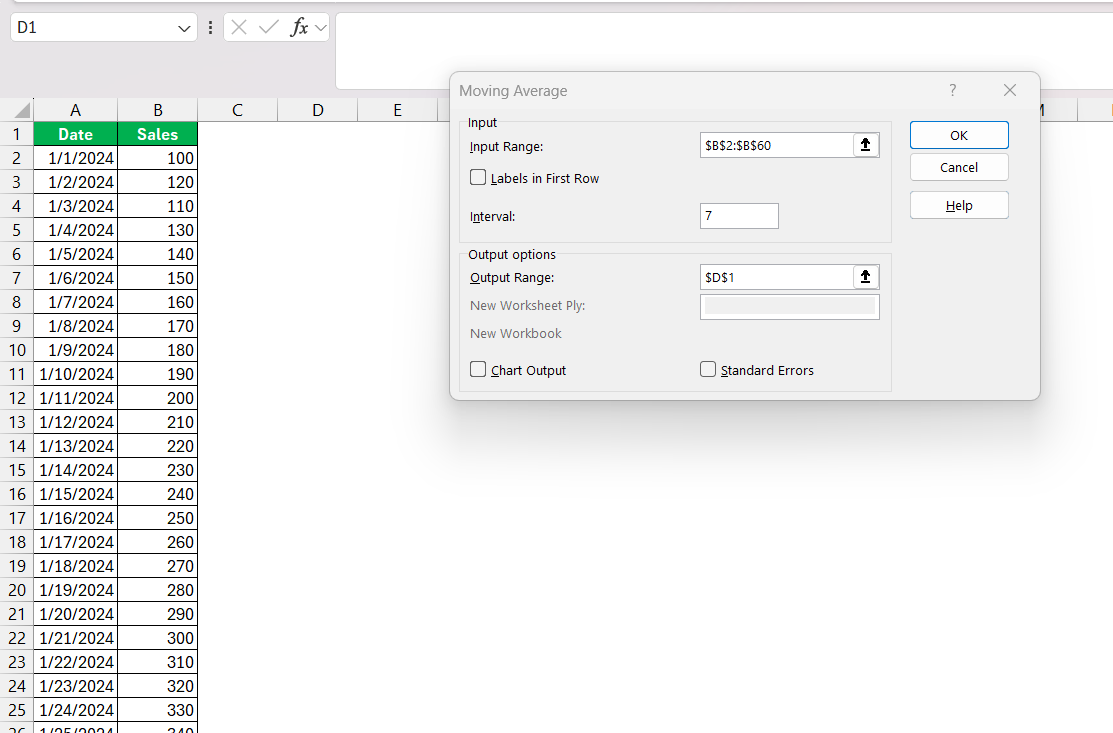
STEP 5: In the pop-up window, enter the range of my data and specify where I want the calculated rolling average to appear. Set the Interval as it determines how many data points the rolling average should encompass. Also, set the location where you want to display the output.
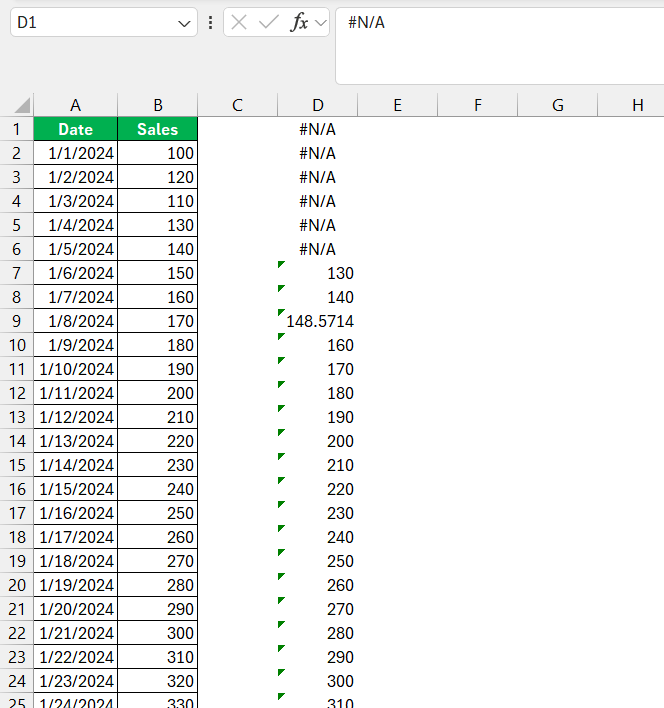
For example, utilizing the Analysis ToolPak, I can input my sales figures, select a 7-day interval, and have a rolling average calculated alongside a graph of the results with just a few clicks. It’s like having an expert assistant do the legwork, making my job a whole lot easier.
The primary benefit of this feature is the sheer time-saving and increased accuracy it brings to the table—there’s less room for manual error because Excel lays out the formulas automatically. However, as with any auto-generated function, I remain vigilant and check the output to ensure that everything seems in order with my data.
Practical Applications of Excel Rolling Averages
Real-world Scenarios Using Rolling Averages
In real-world scenarios, rolling averages are applied to smooth out short-term volatility and highlight longer-term trends in various fields:
- Stock Market Analysis: Traders often use a 50-day or 200-day moving average to decide on the momentum of a stock. This average gives them a clearer perspective, filtering out the daily noise in price movements.
- Weather Forecasting: Meteorologists rely on rolling averages to moderate daily temperature fluctuations, providing a more stable gauge of climate trends.
- Economic Indicators: Financial analysts apply rolling averages to key economic data like unemployment rates to adjust for seasonal employment bursts and offer a clearer economic outlook.
These practical applications underscore rolling averages’ versatility as an analytical tool, offering a smoothed perspective that often leads to better, more informed decisions.
FAQs
How to do a rolling average formula in Excel?
To create a rolling average in Excel, I use the AVERAGE function with relative cell references. First, I decide the number of periods (e.g., 7 days). In the starting cell, I enter =AVERAGE(range) using the data from the previous periods (e.g., days 1 to 7 for the 8th day). After pressing Enter, I drag the fill handle down to copy the formula, automatically adjusting it for each new period.
How to calculate the rolling average?
To calculate a rolling average, I designate a specific number of periods, use the AVERAGE function, select the corresponding range, and then copy the formula down the column. This way, each cell calculates the average of the dataset for that window, updating continuously as it moves down the column.
What Are the Most Common Mistakes When Calculating Rolling Averages in Excel?
Common mistakes include incorrect cell references which lead to inaccurate averages, not adjusting the formula range when new data is added, and overlooking the need for consistent data (no gaps or anomalies). It’s also vital not to confuse the term “average” with “rolling average,” as these can yield very different insights.
How Can I Calculate a Rolling Average for Non-Consecutive Data Points?
For non-consecutive data points, a combination of functions like AVERAGEIFS or SUMIFS and COUNTIFS can be used to compute a rolling average. The key is to define the criteria for inclusion in the average calculation, ensuring the specified conditions are met despite the gaps.
What is the formula for the 7-day rolling average?
The formula for a 7-day rolling average in Excel starts with the AVERAGE function followed by selecting a range of 7 consecutive cells. If I’m creating it in cell C8, for example, the formula would be =AVERAGE(B2:B8), and then dragged down from C8 to apply it to the rest of the column.
John Michaloudis is a former accountant and finance analyst at General Electric, a Microsoft MVP since 2020, an Amazon #1 bestselling author of 4 Microsoft Excel books and teacher of Microsoft Excel & Office over at his flagship MyExcelOnline Academy Online Course.

